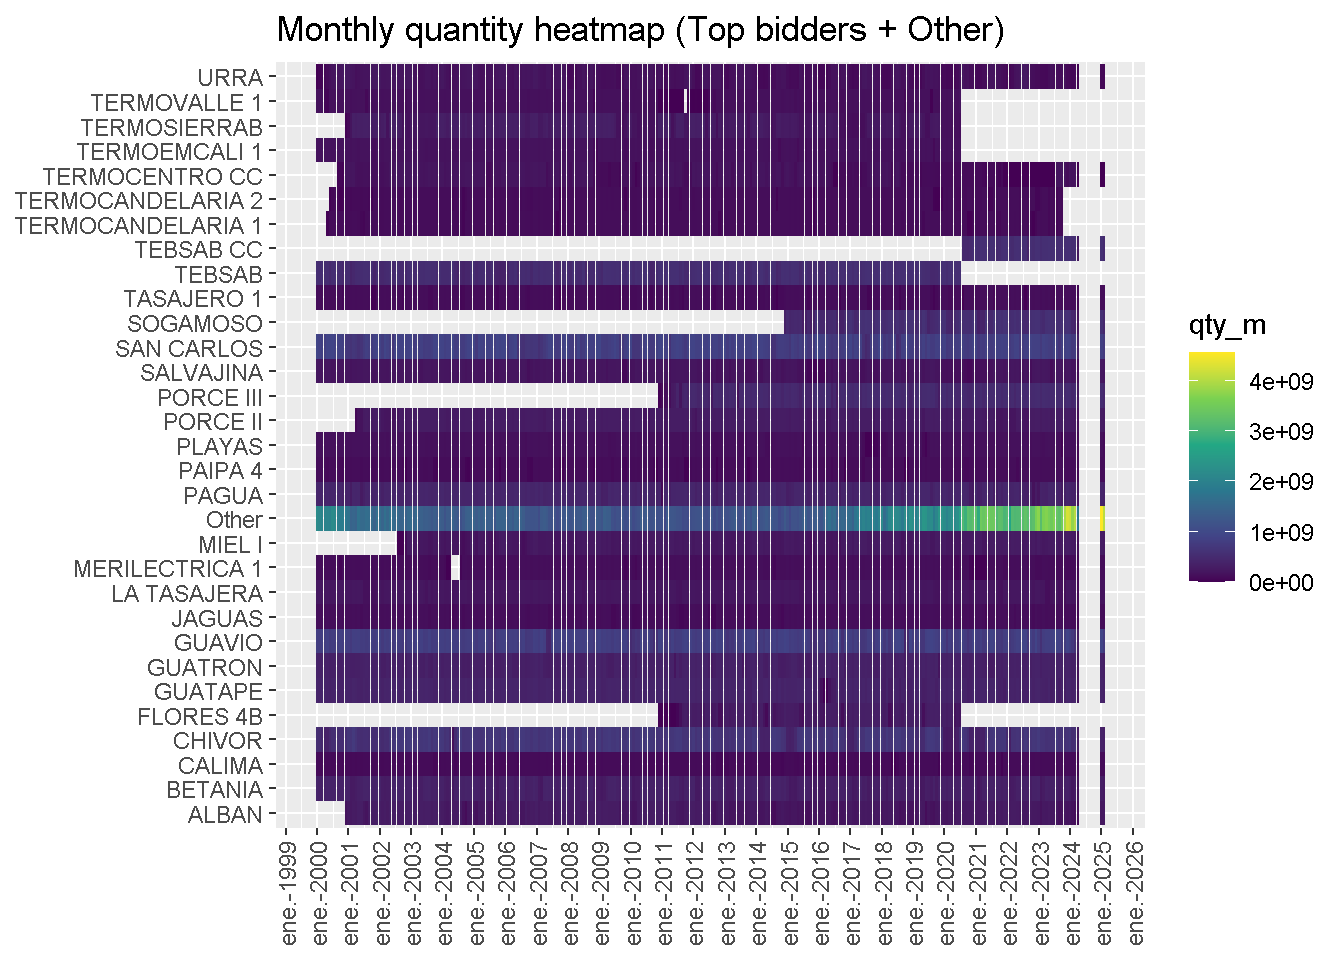
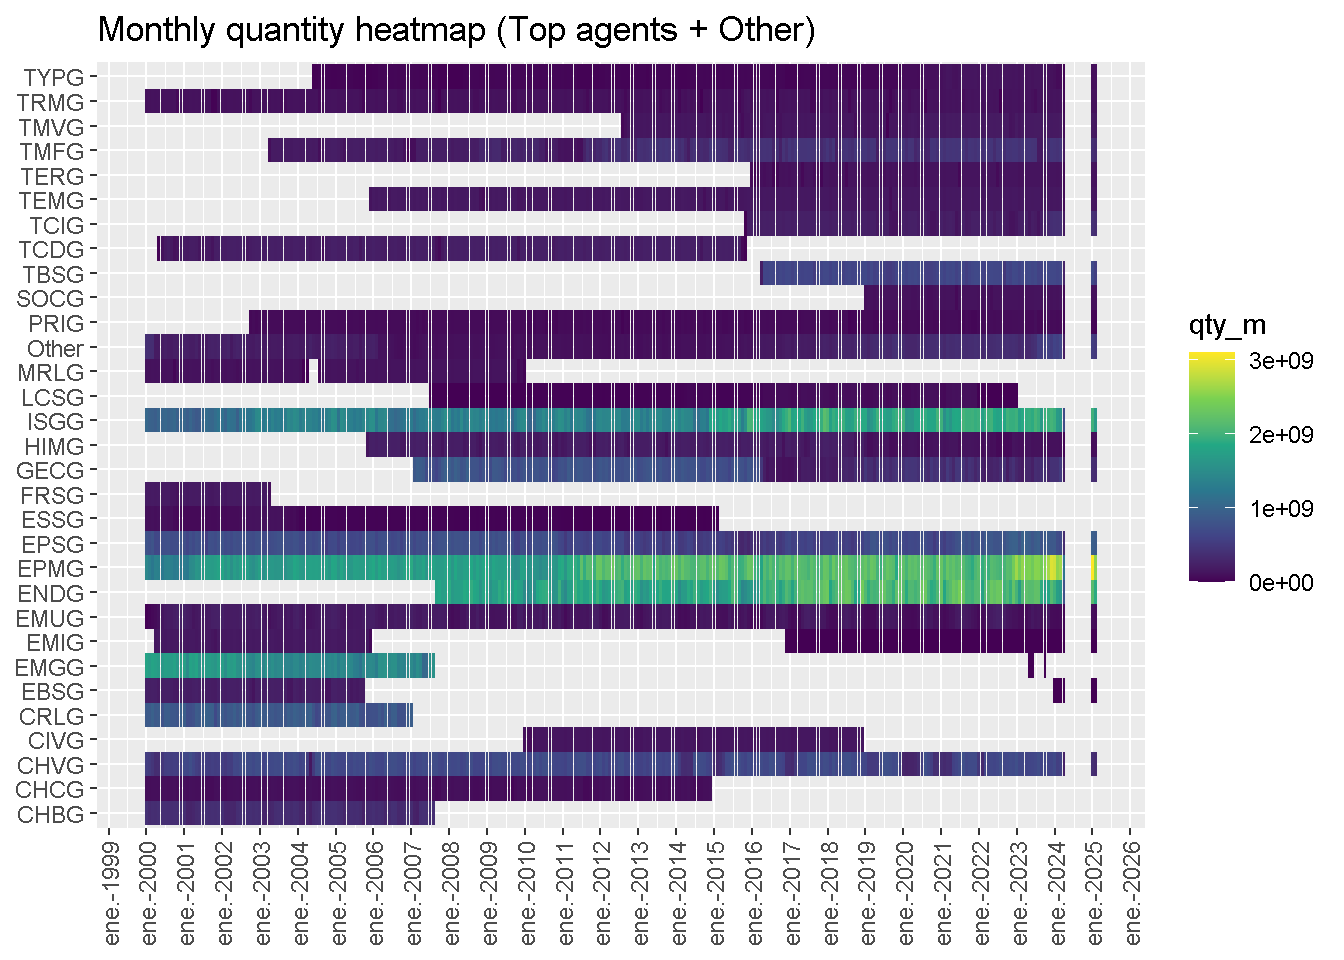
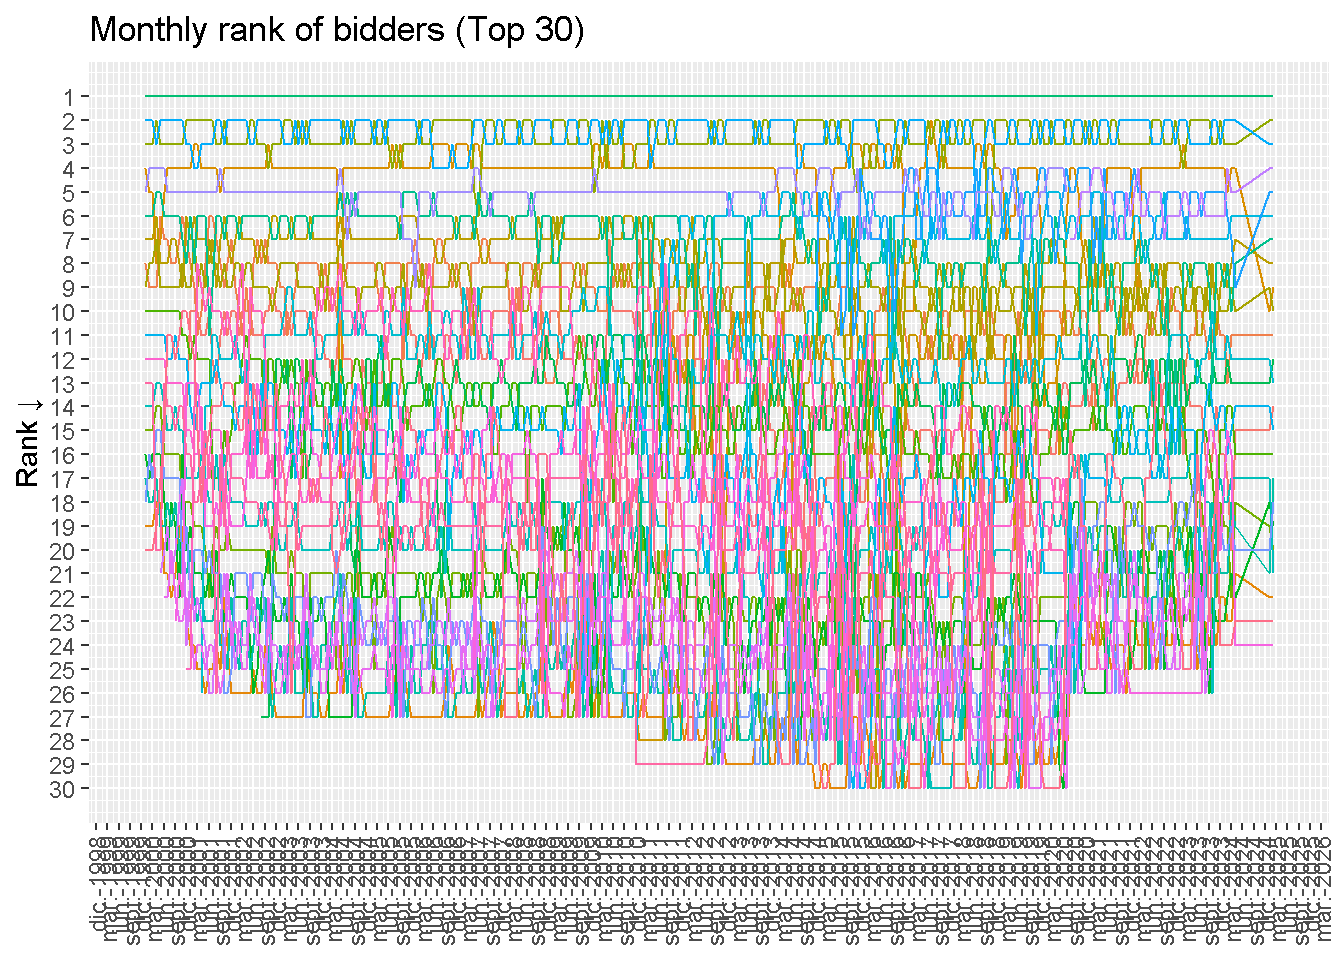
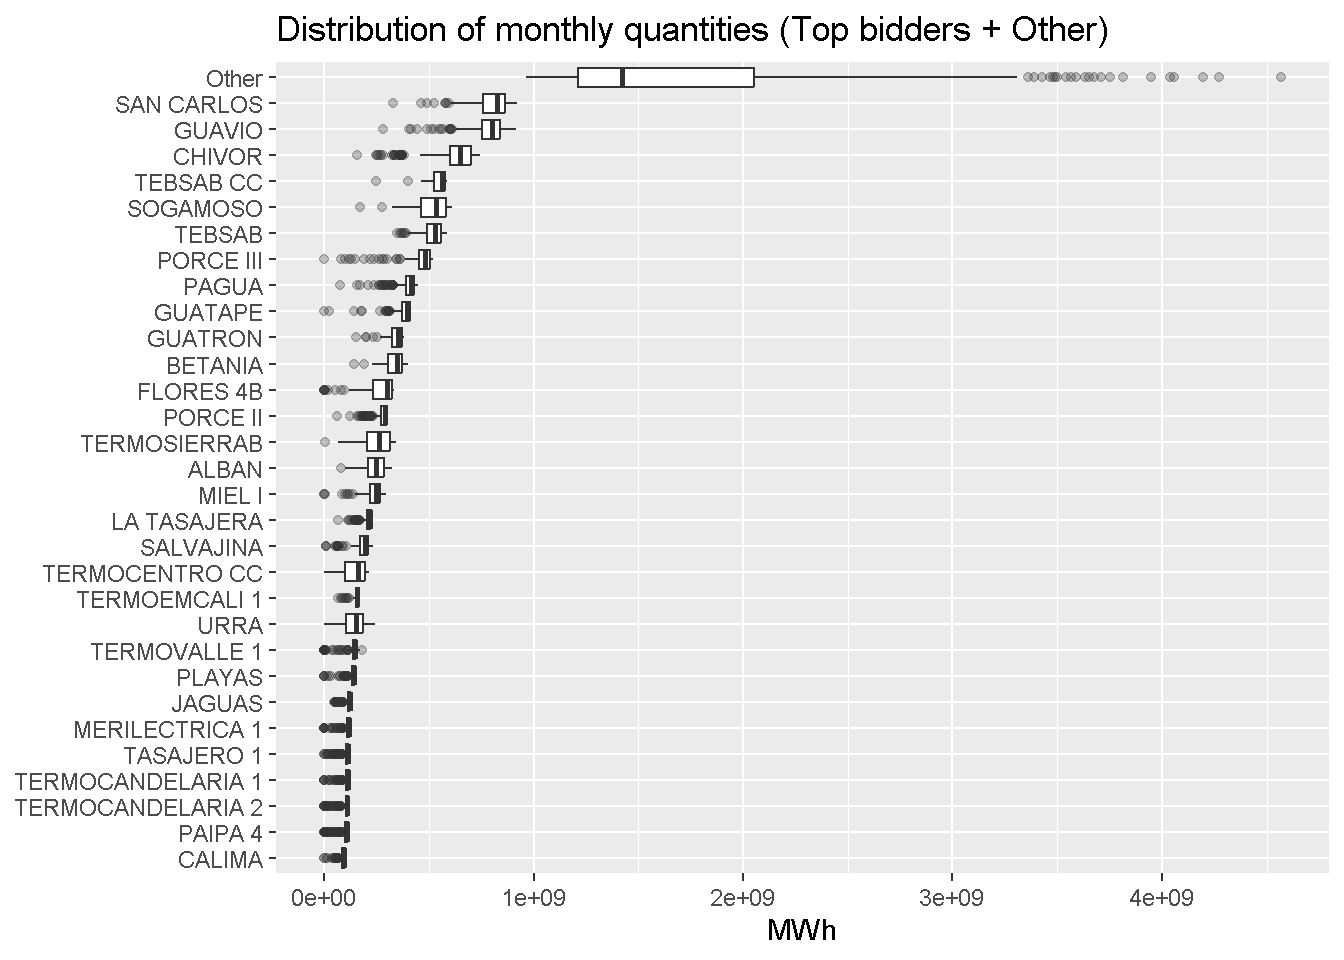
Quantities
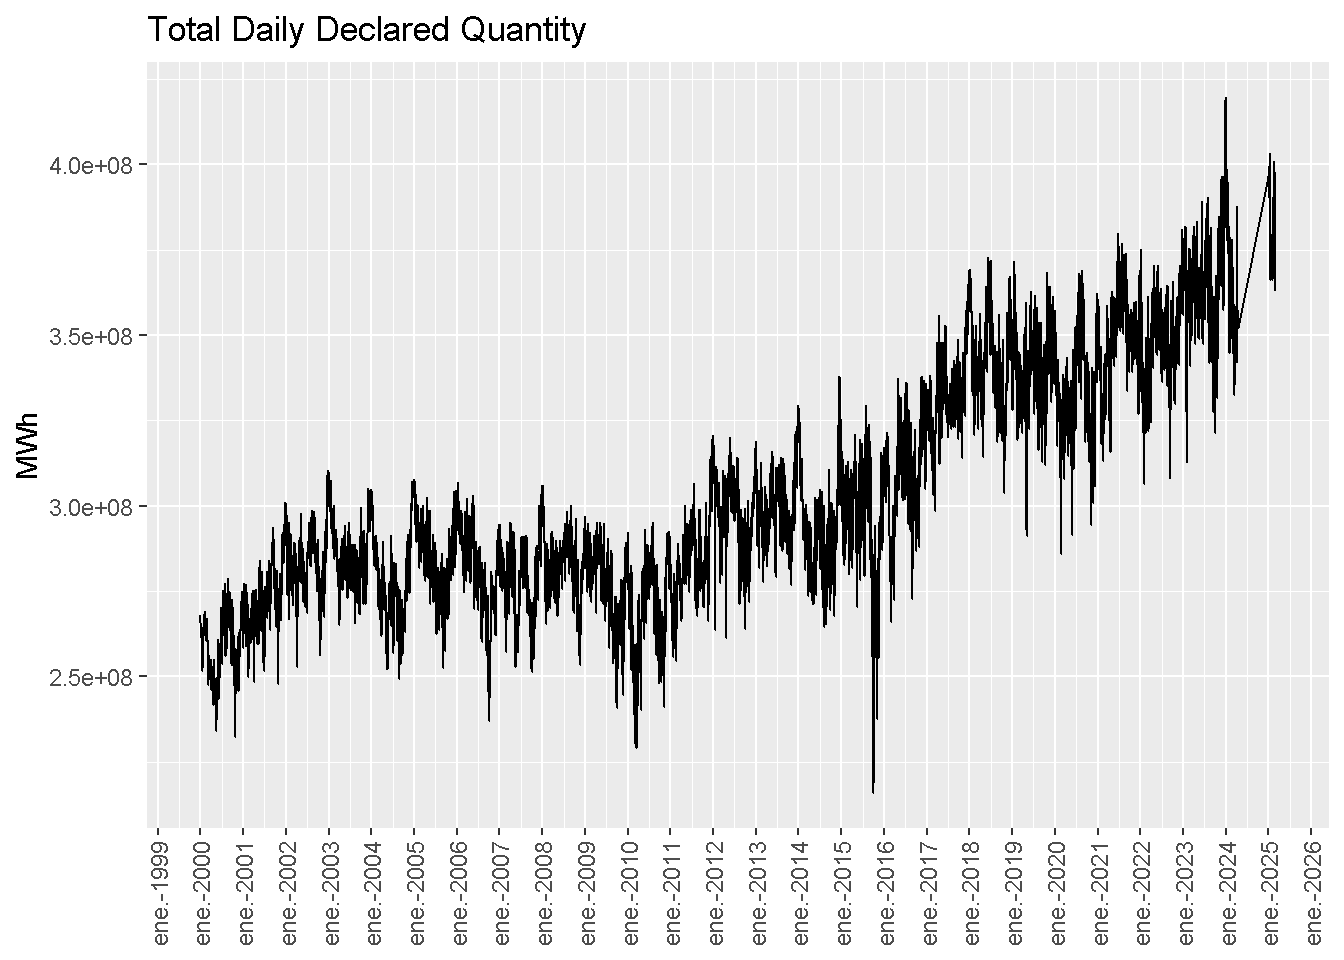
Plot 1 — Total Daily Declared Quantity
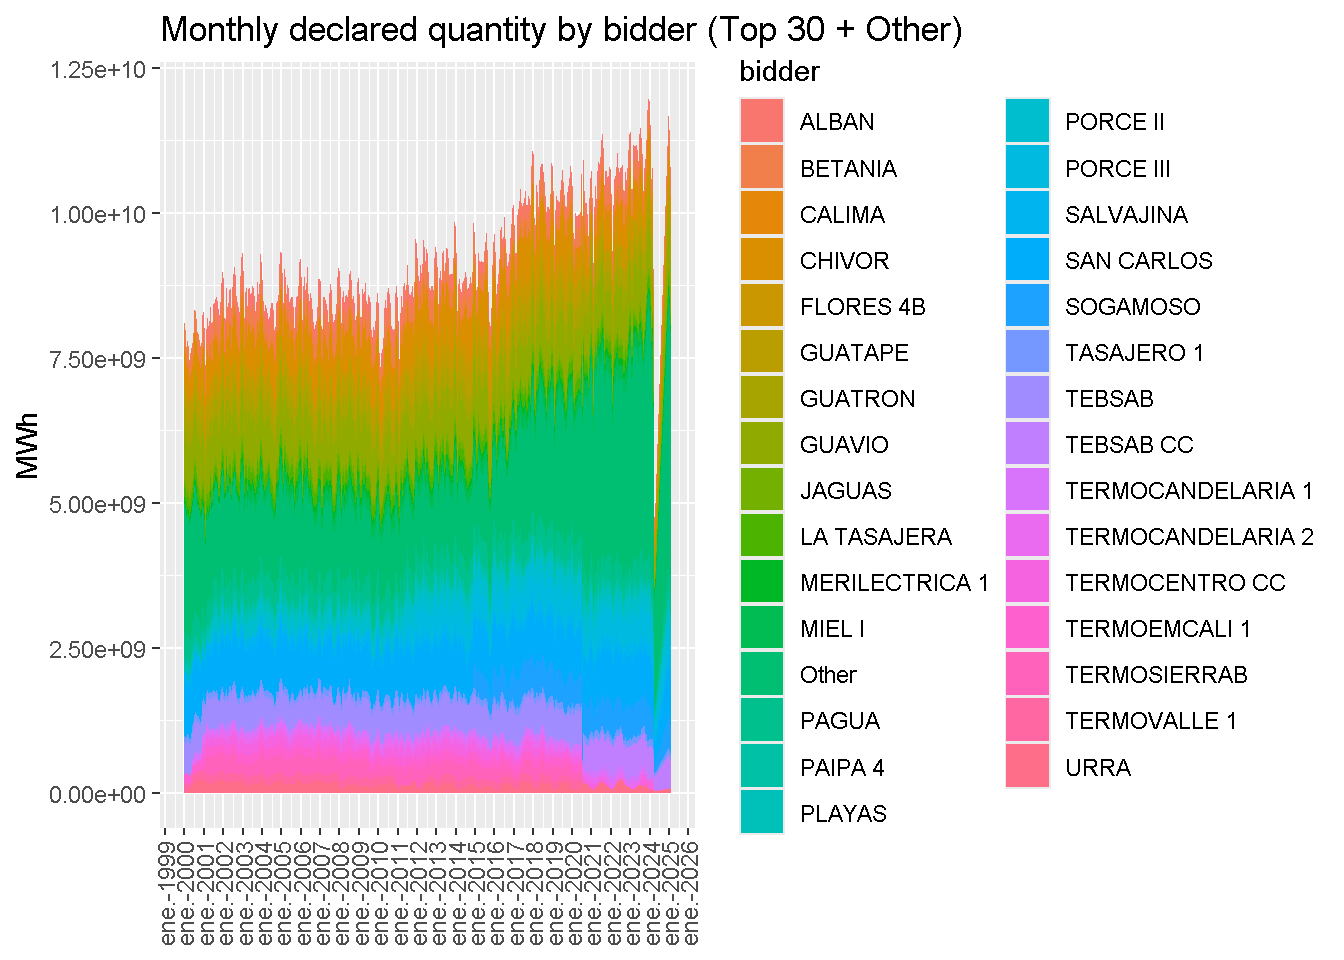
Plot 2 — Stacked Area by Bidder (Levels)
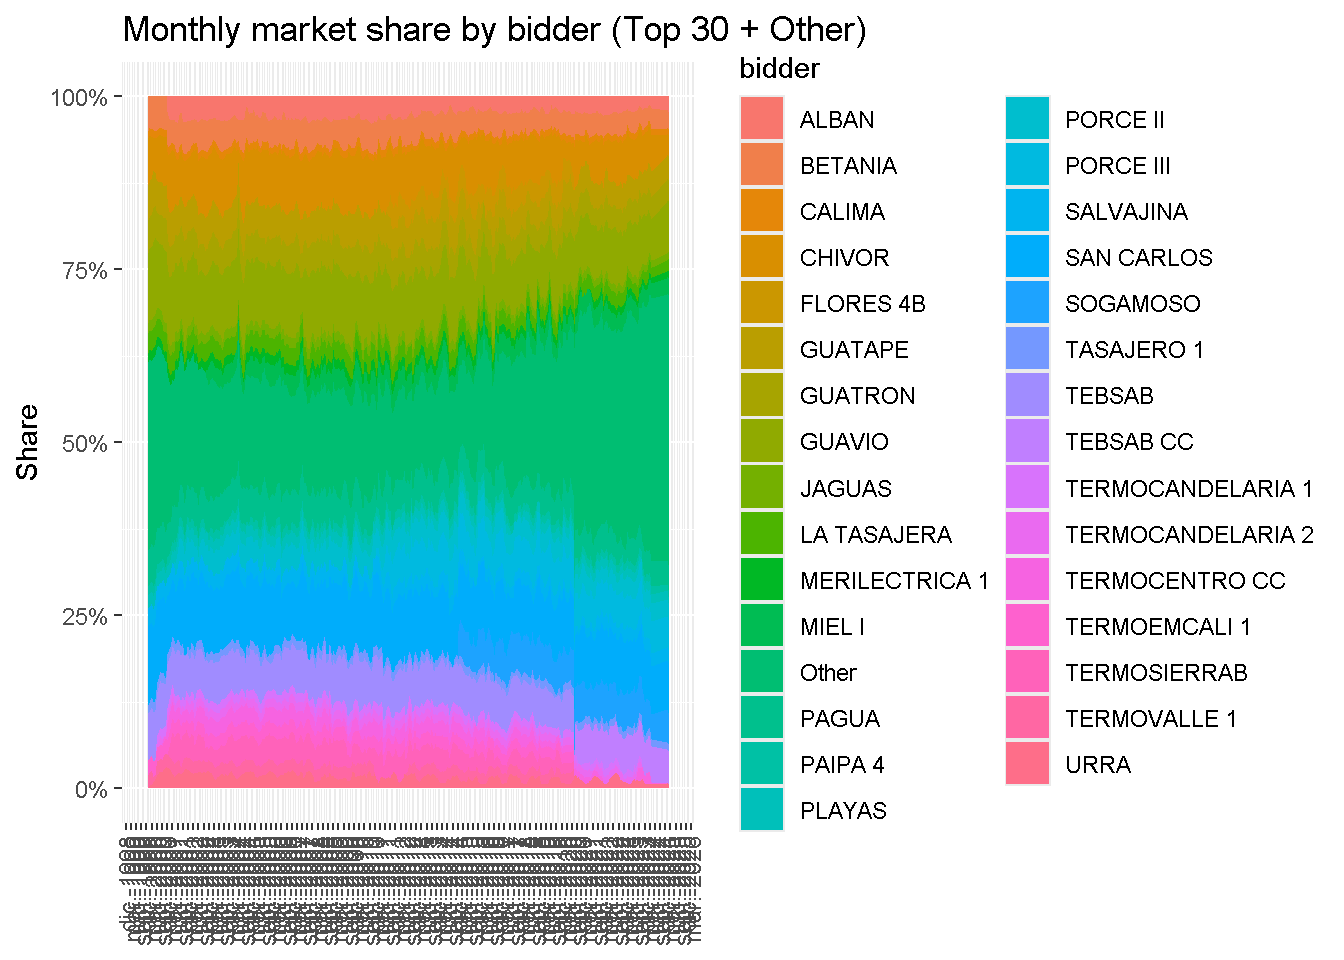
Plot 3 — Stacked Area by Bidder (Shares)
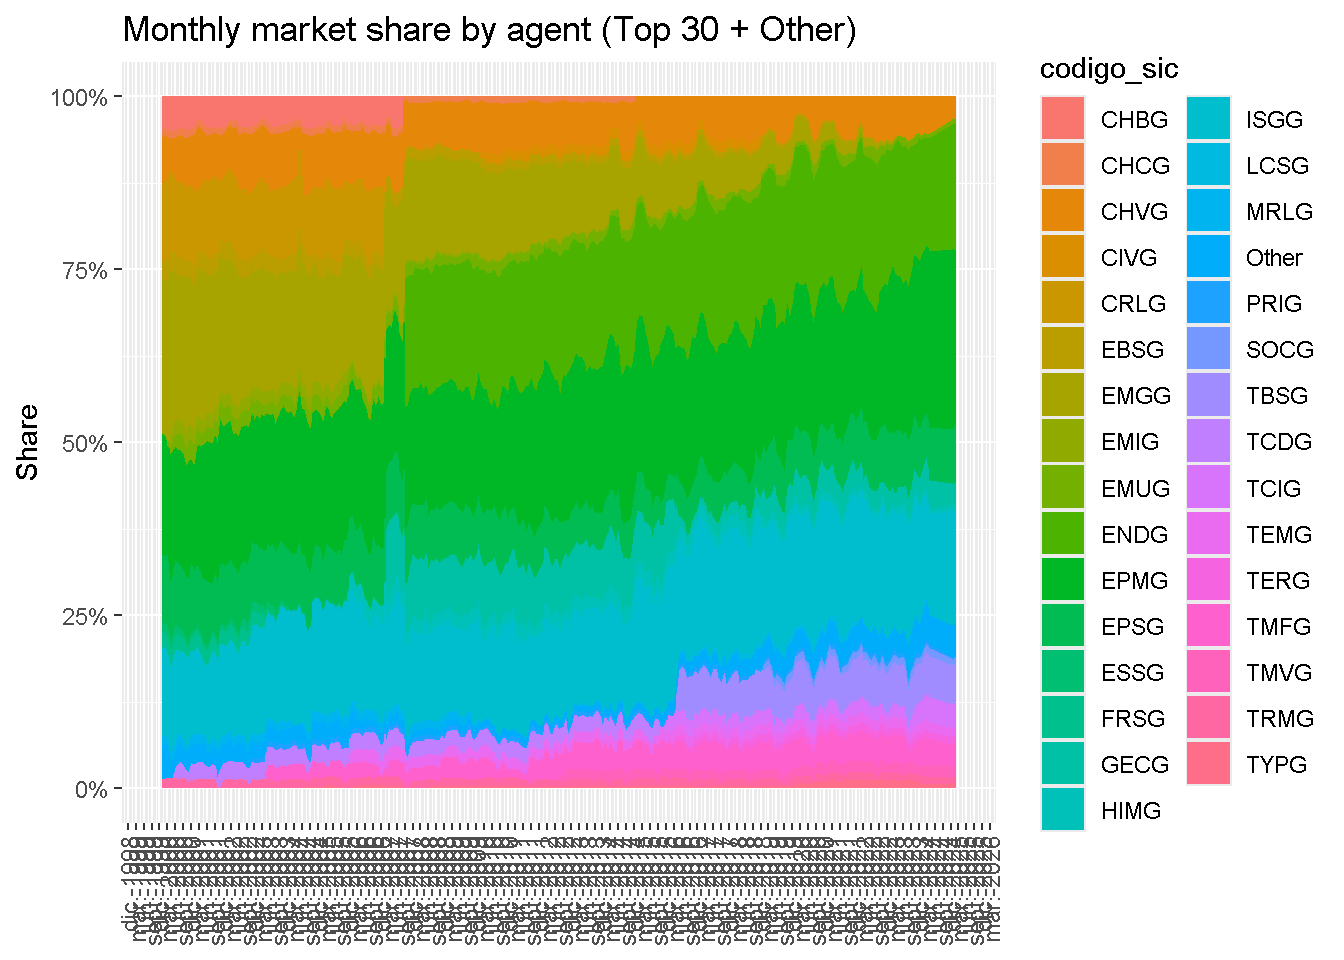
Plot 4 — Stacked Area by Agent (Shares, codigo_sic)
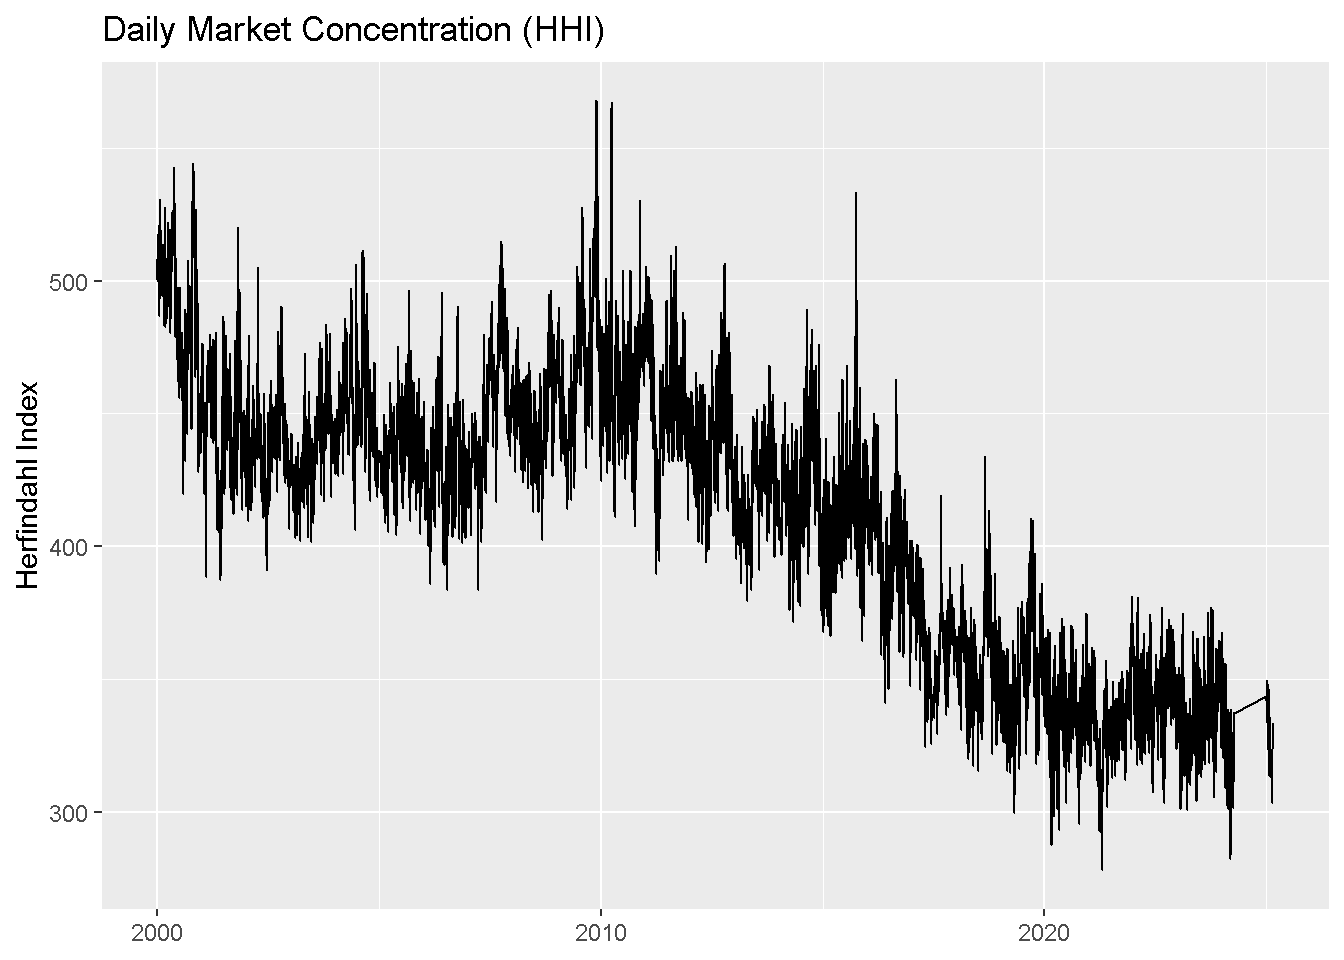
Plot 8 — Daily Market Concentration (HHI)
Water
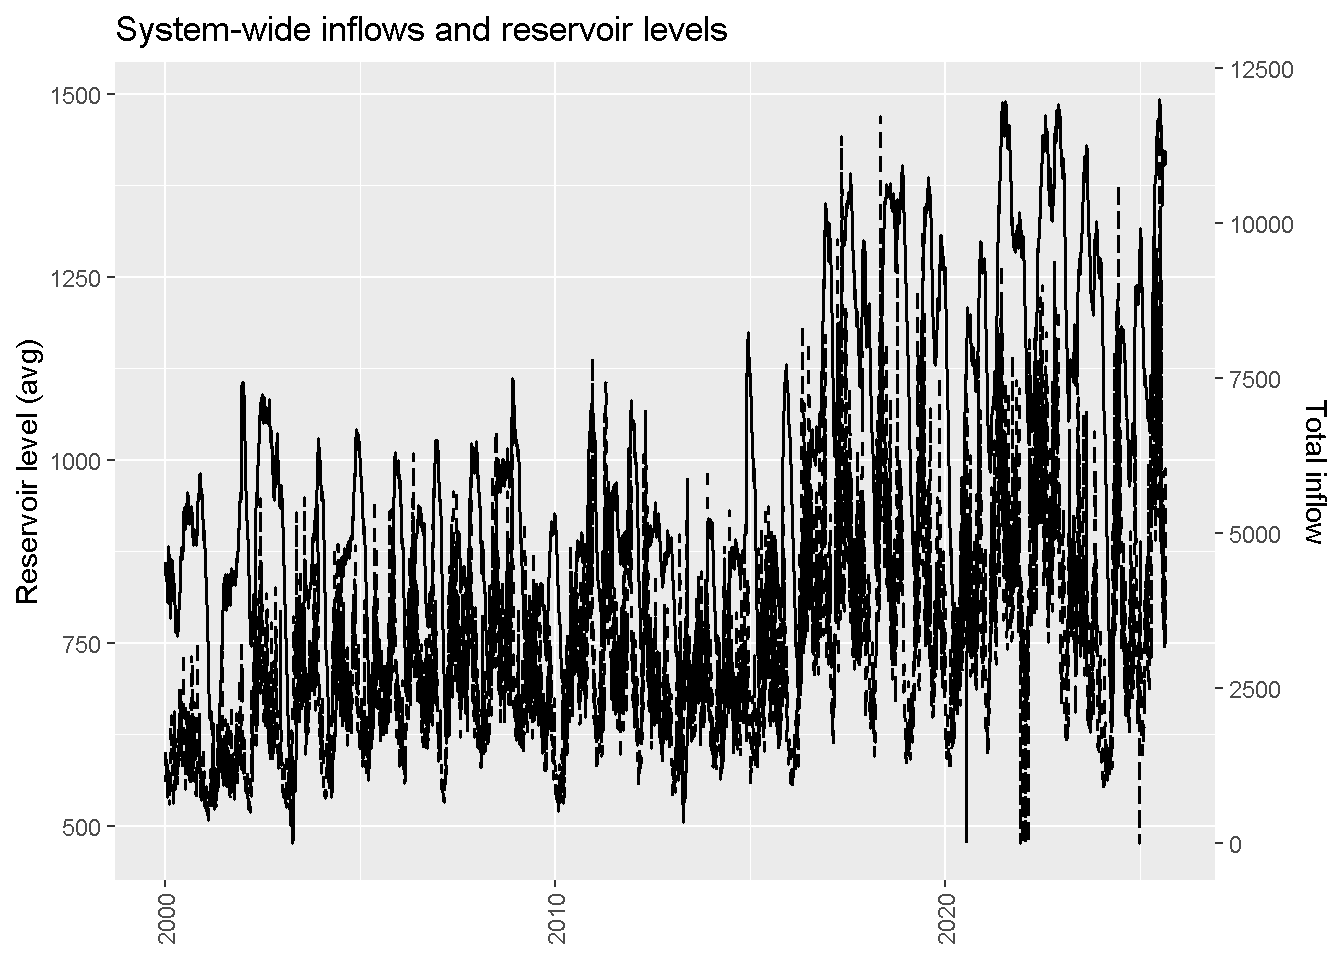
System-wide inflows vs. reservoir levels
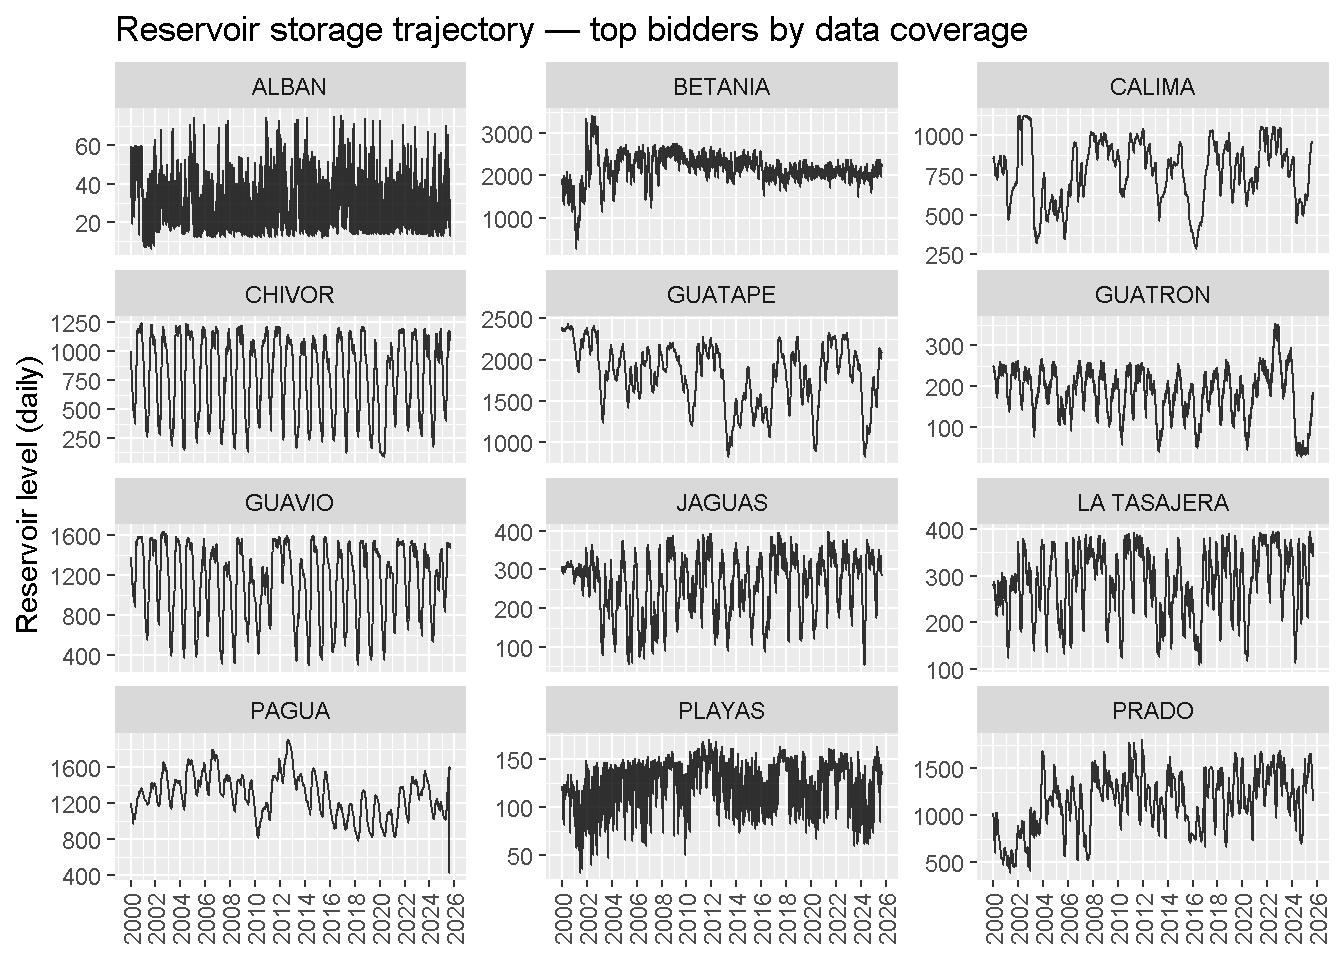
Reservoir storage trajectory — Top 12
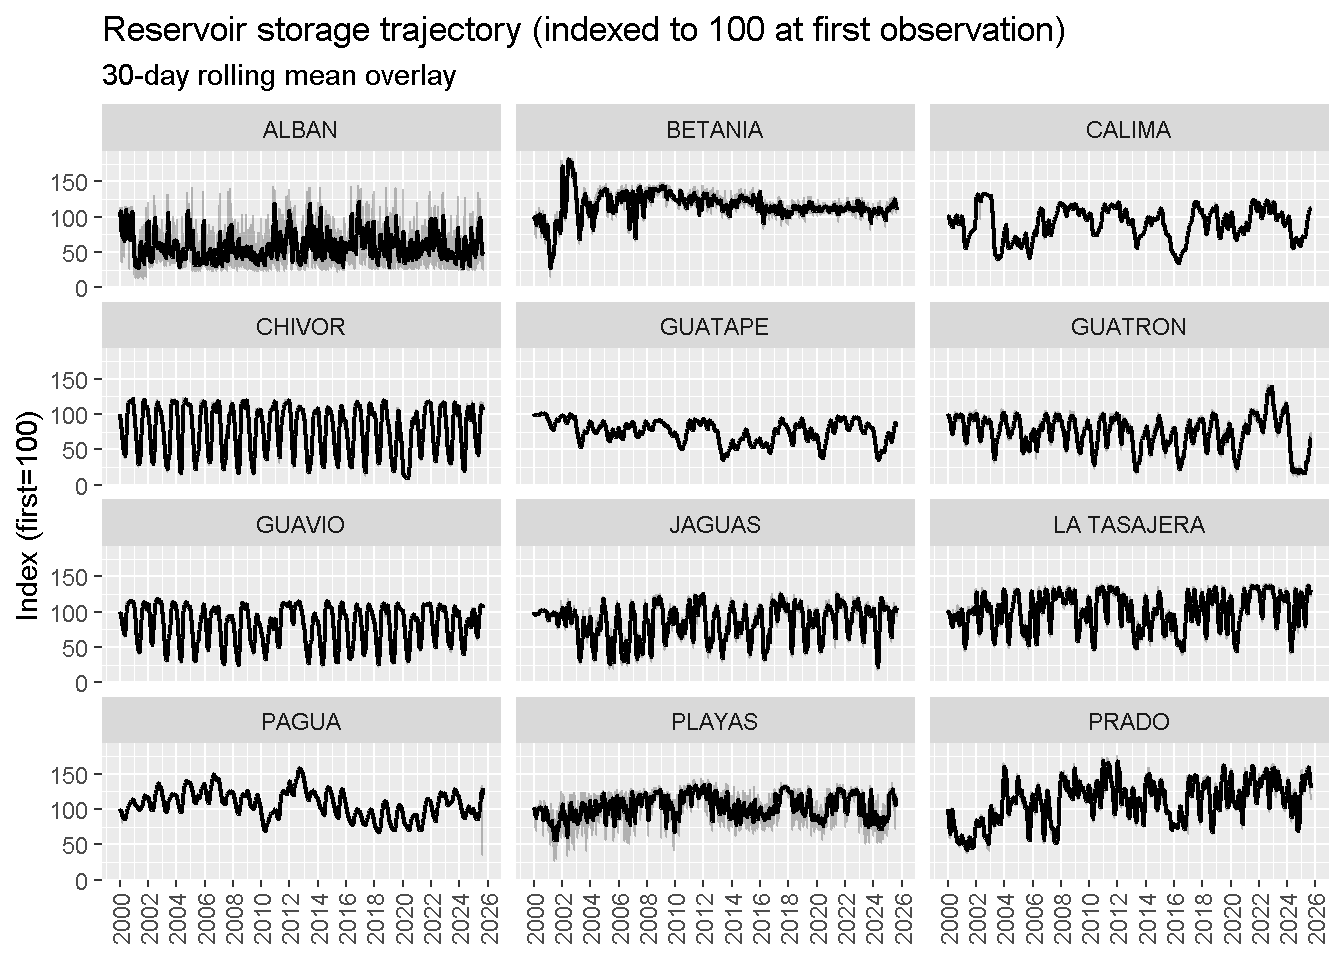
Reservoir indices with rolling mean
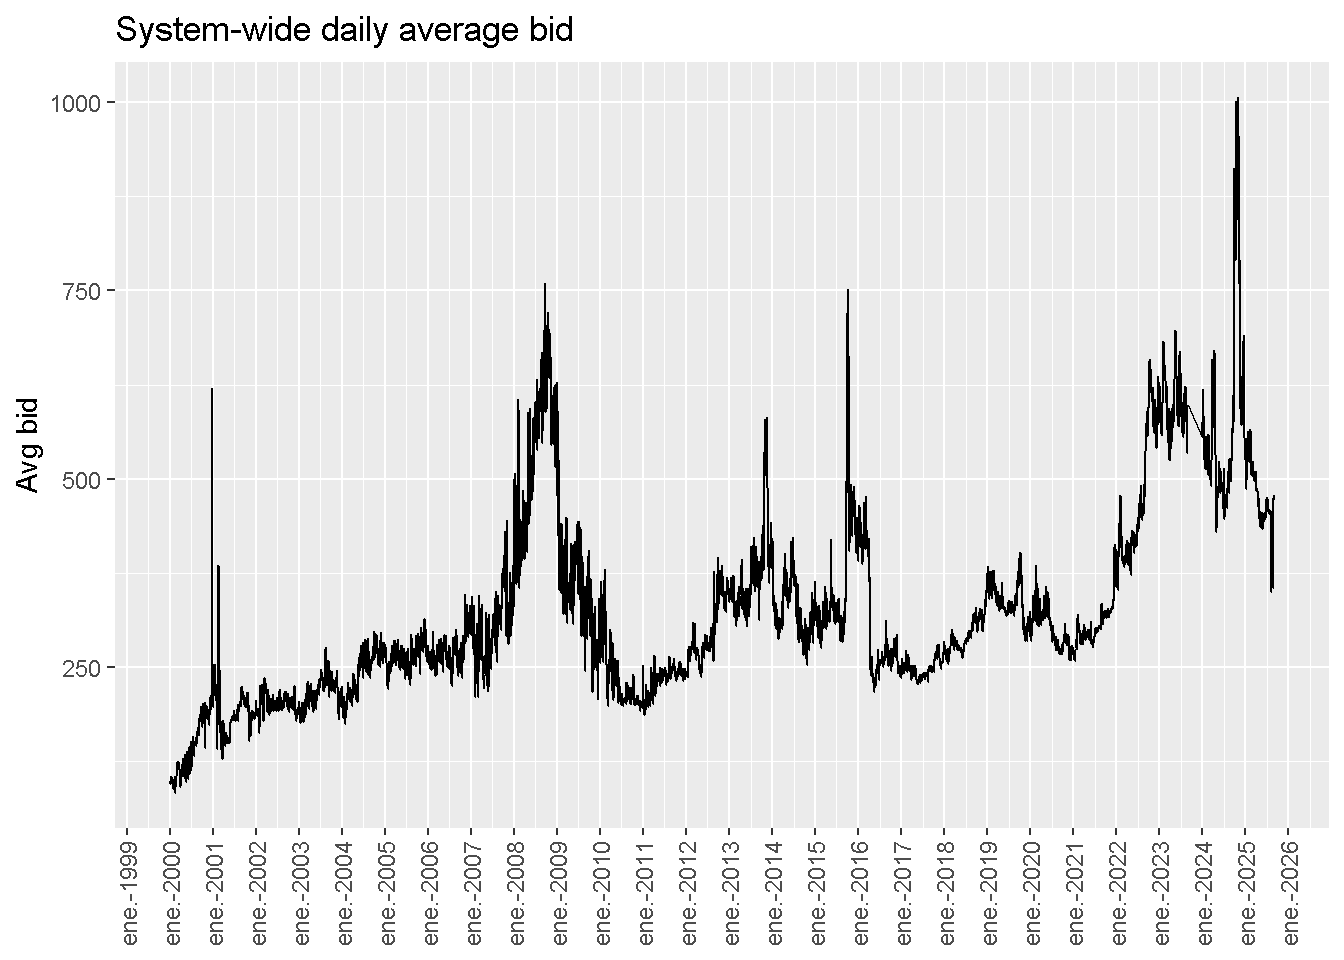
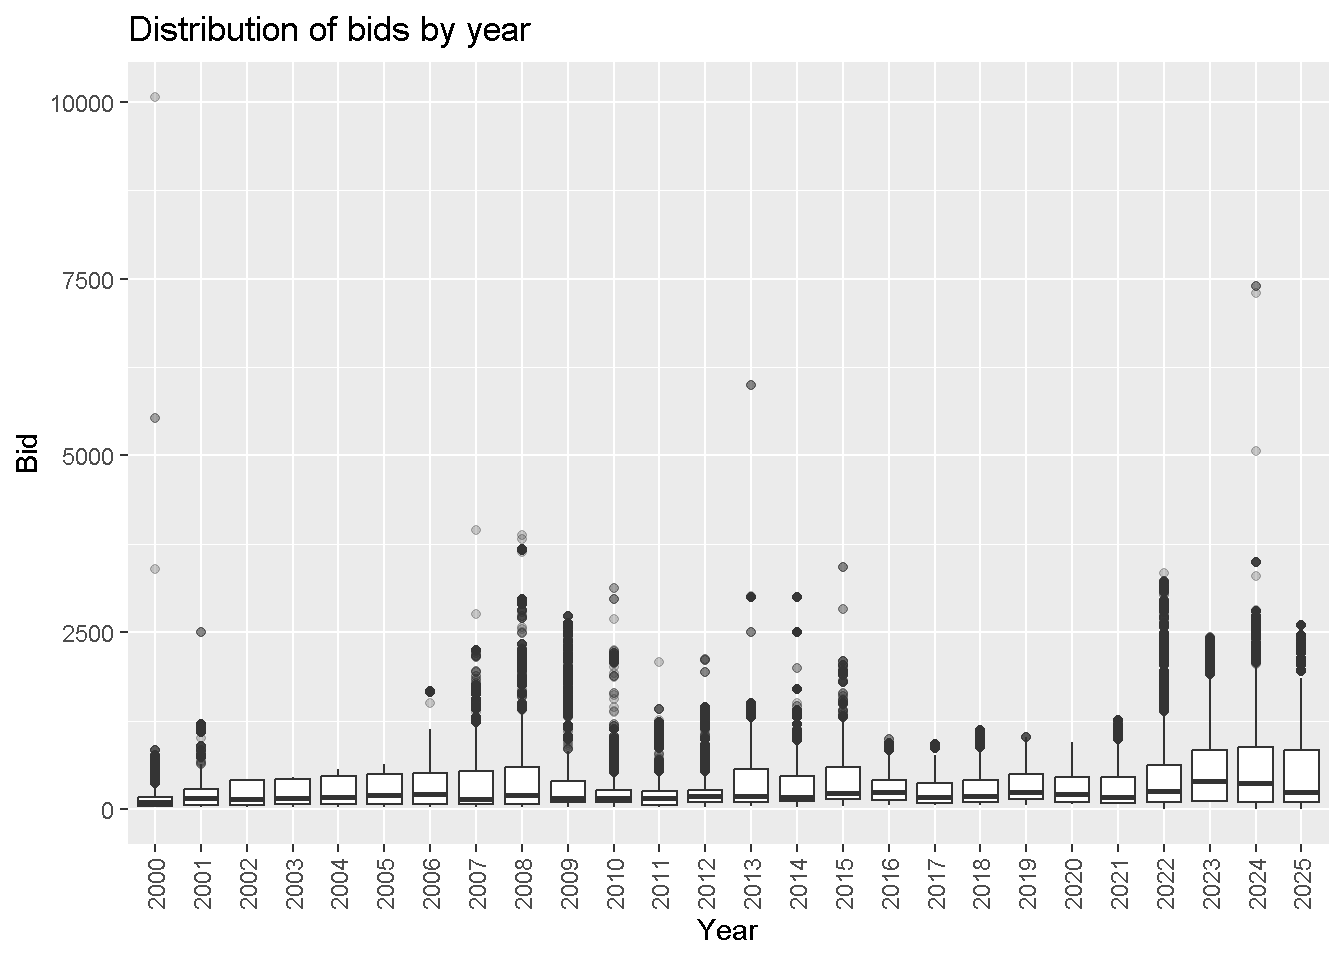
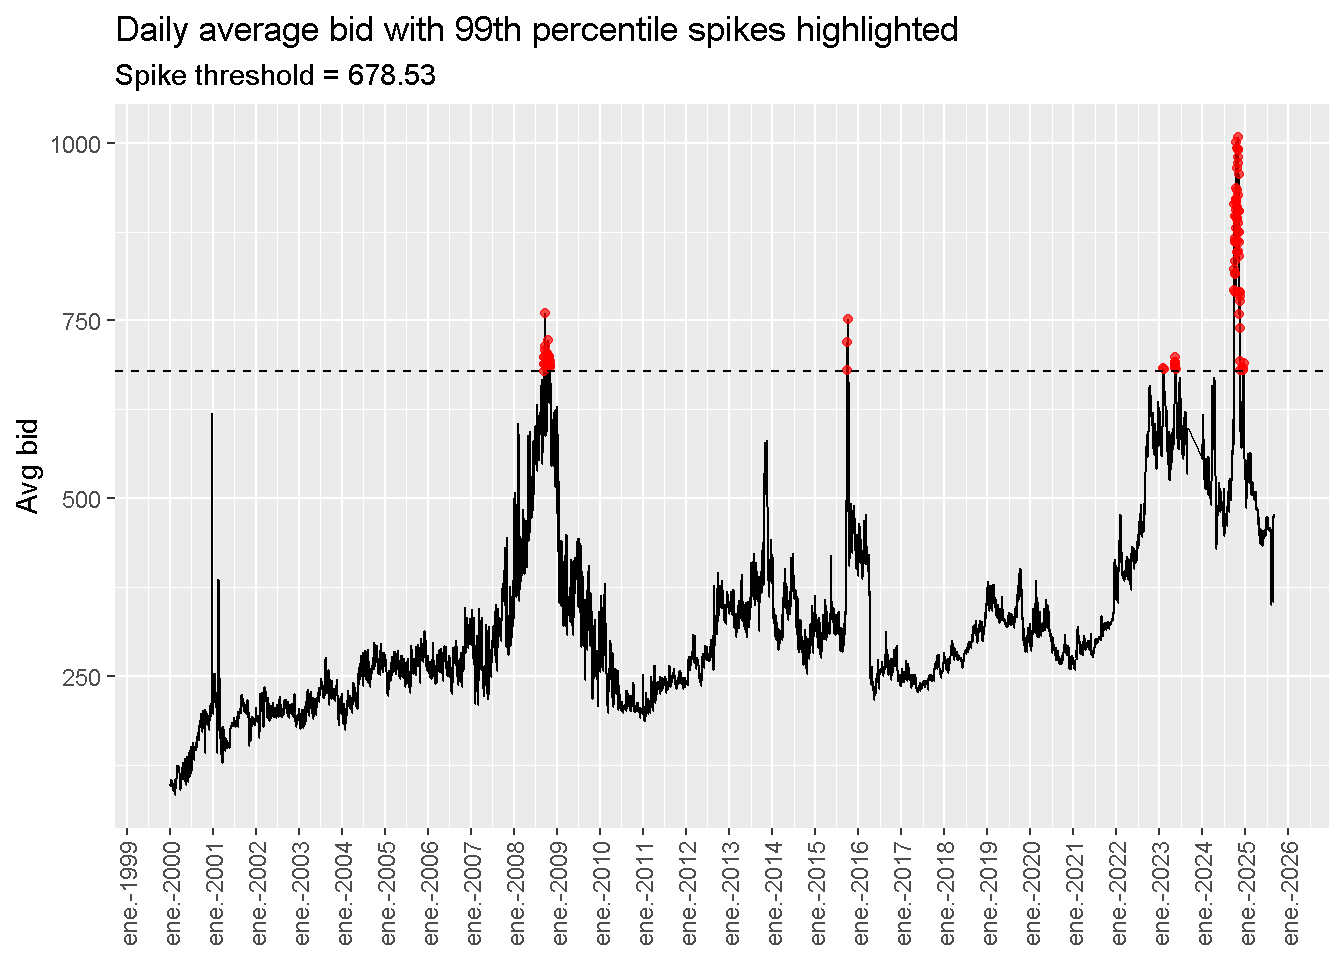
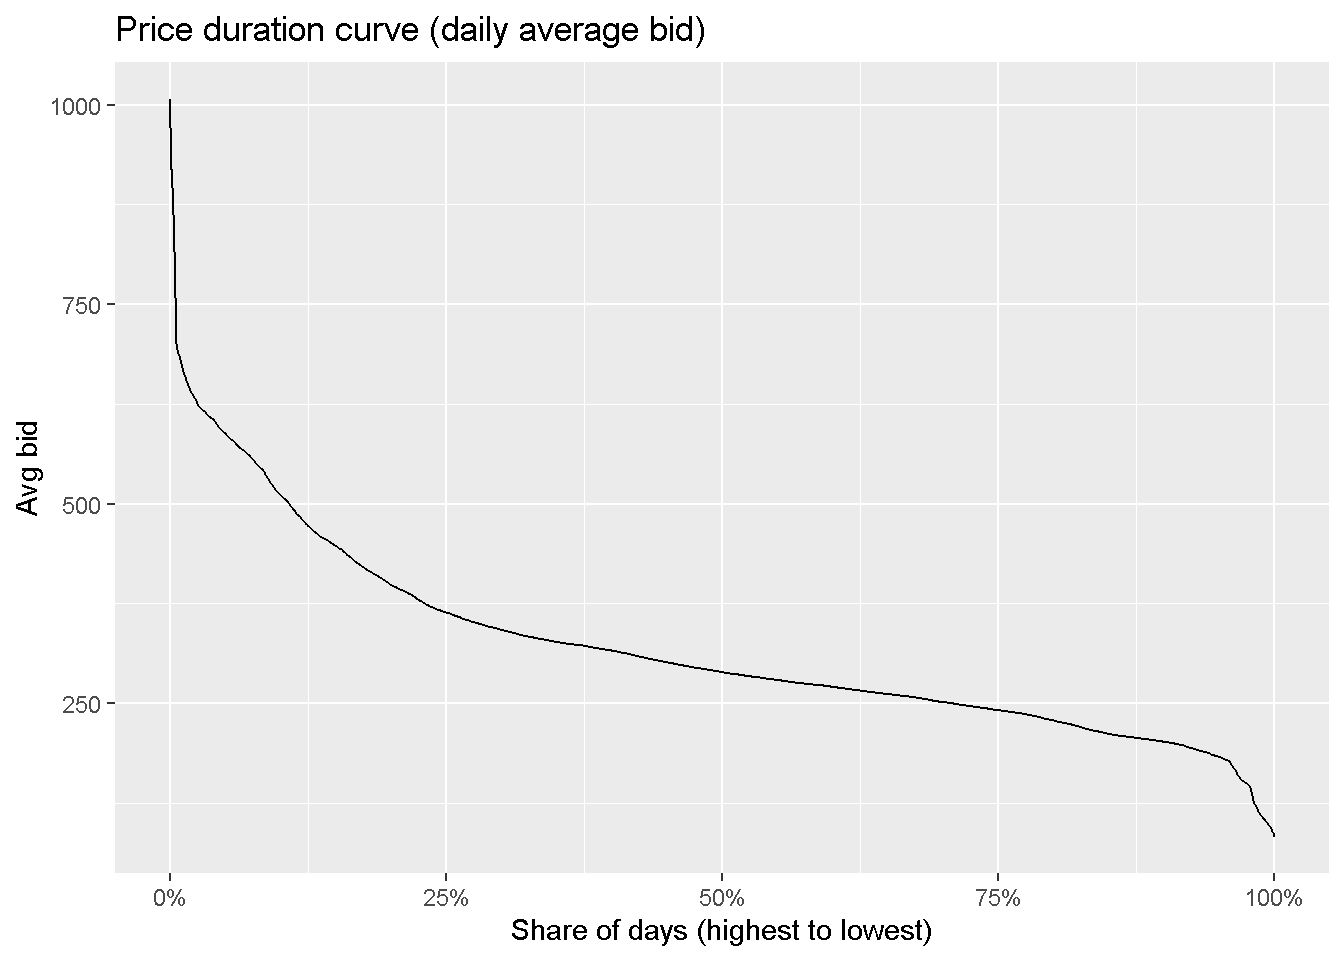
Bids
System-wide daily average bid (time series)
Annual distribution of bids (boxplots)
Spike view (top 1% days highlighted)
Price duration curve (system-wide)
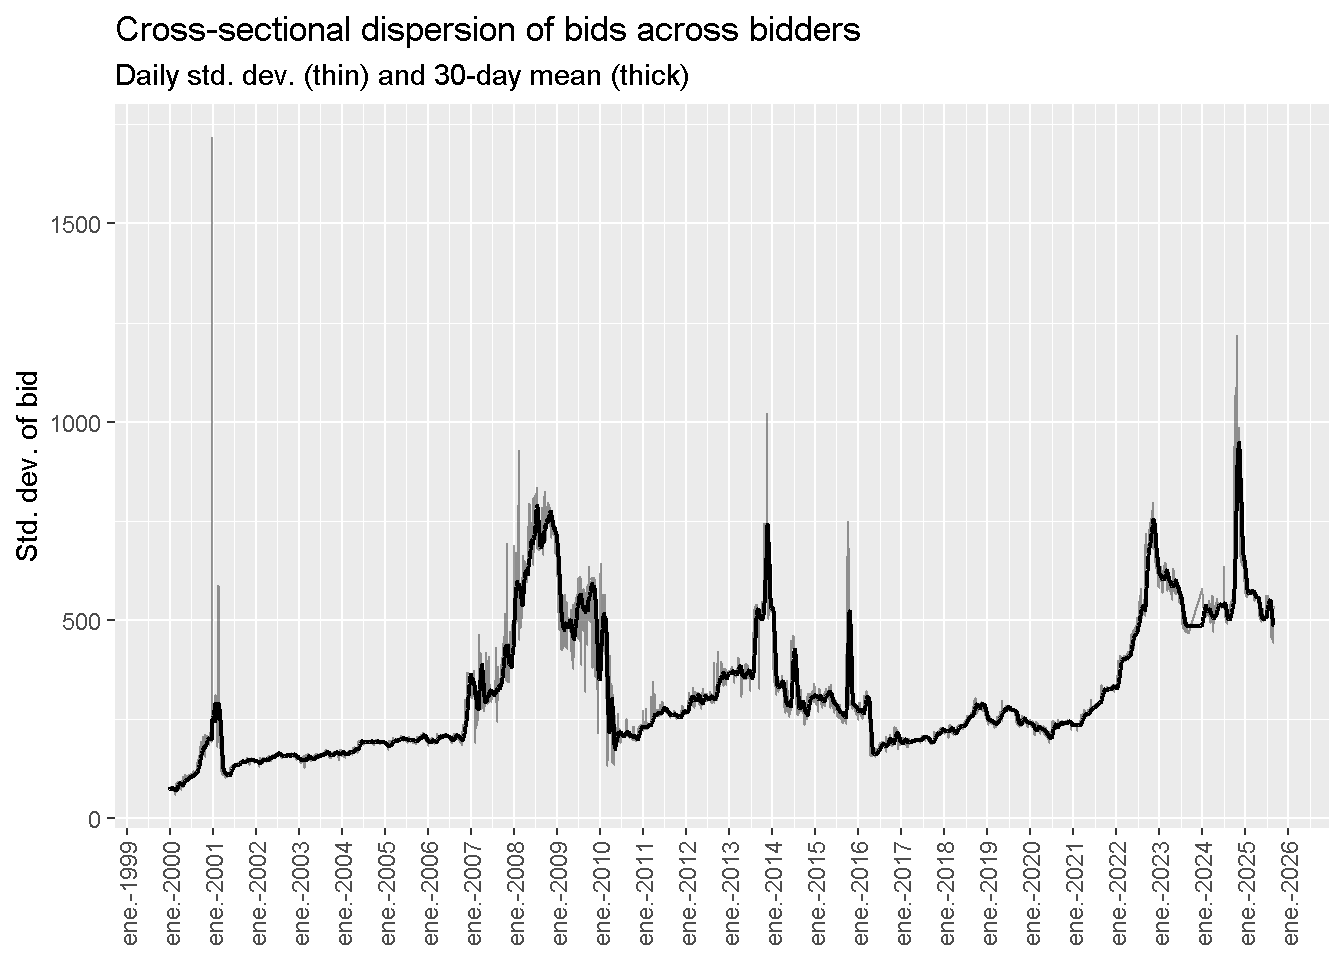
Cross-sectional dispersion (σ and 30-day smoothed)
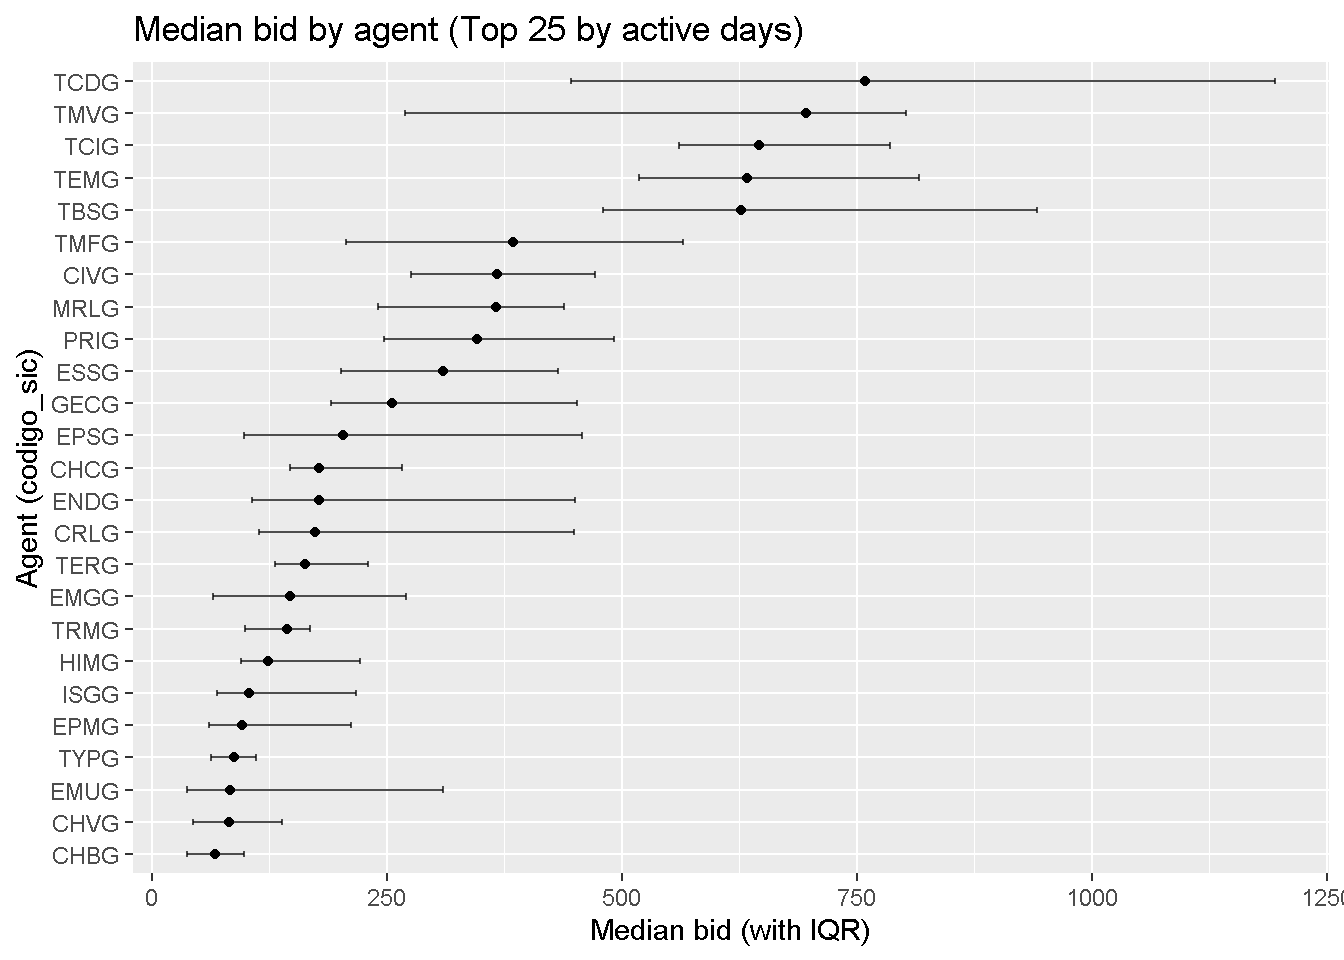
Agent price levels (top-N by active days)
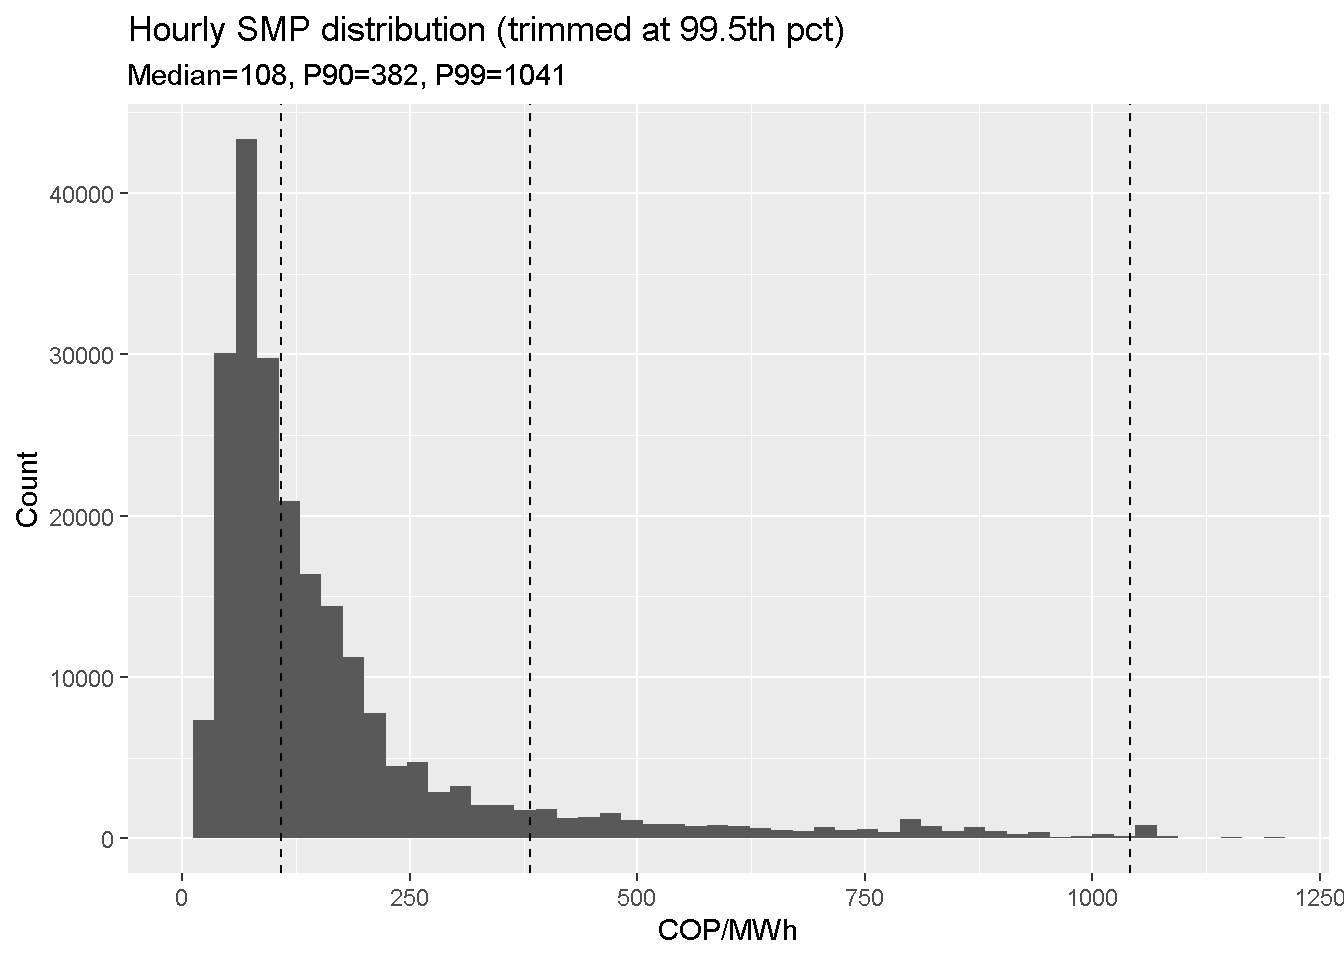
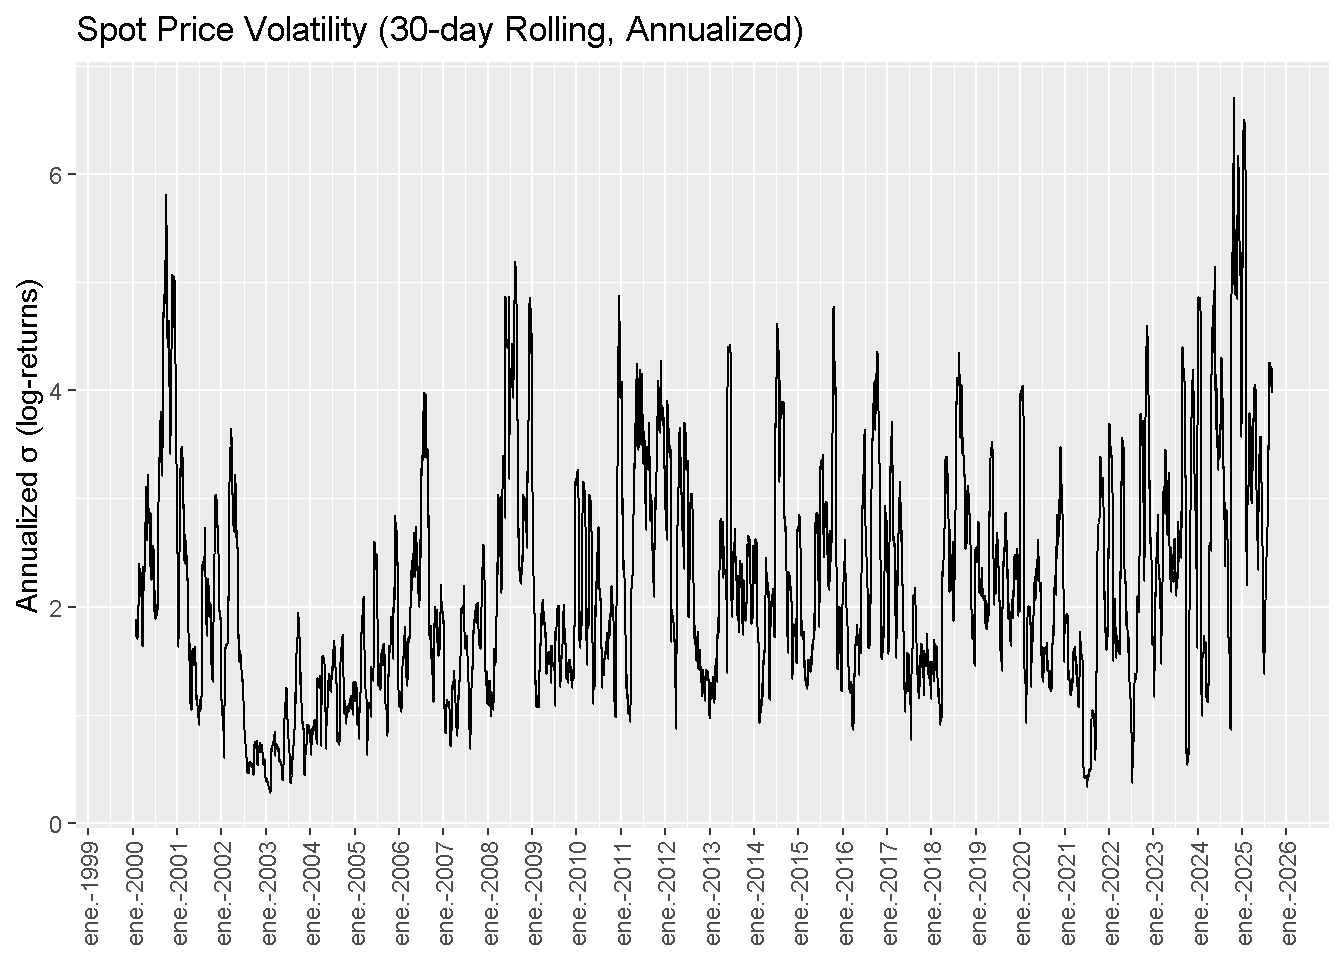
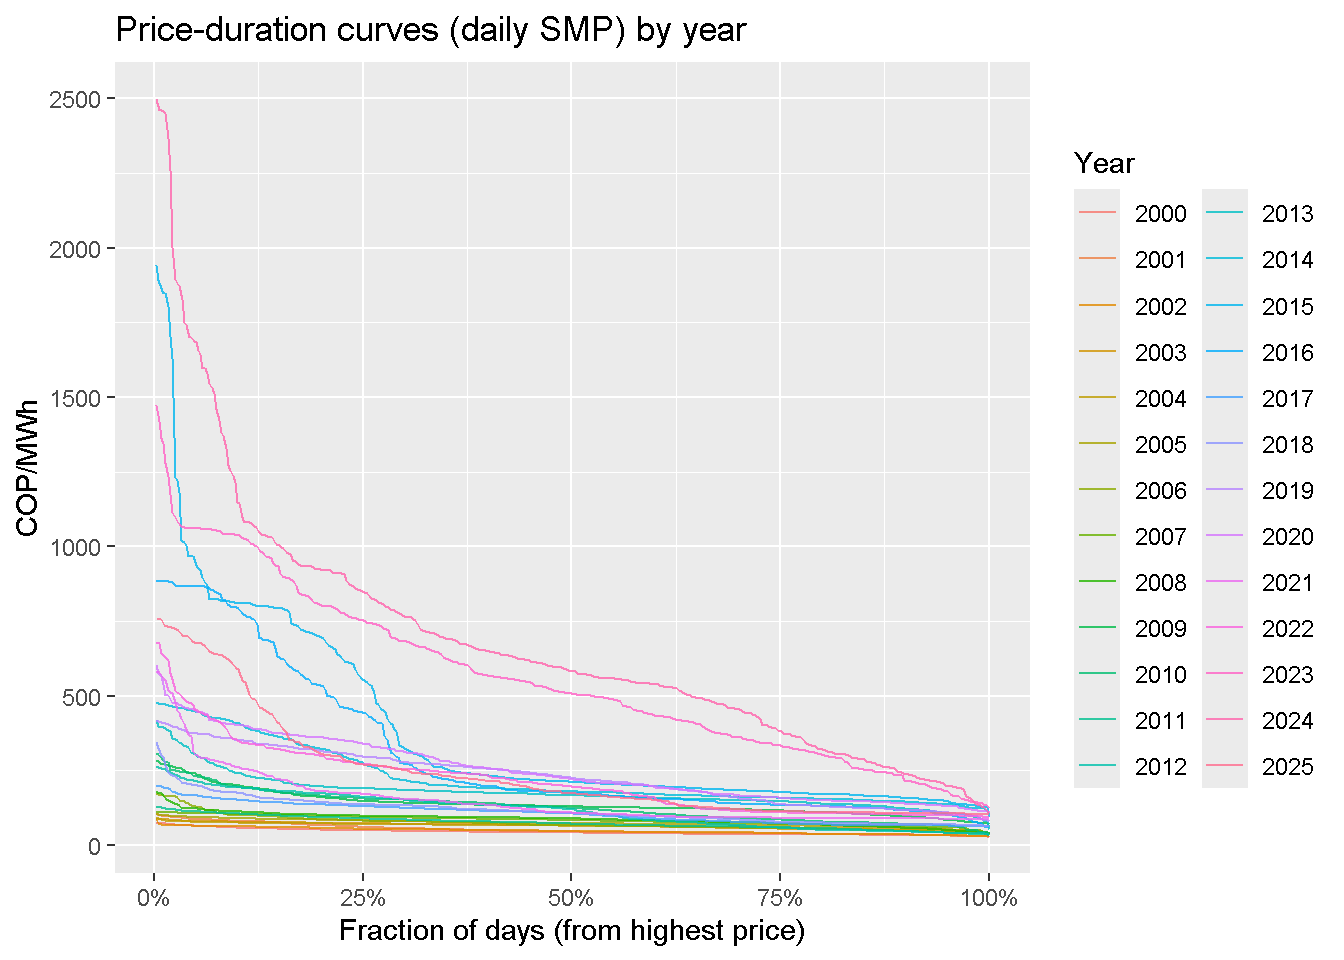
Spot price
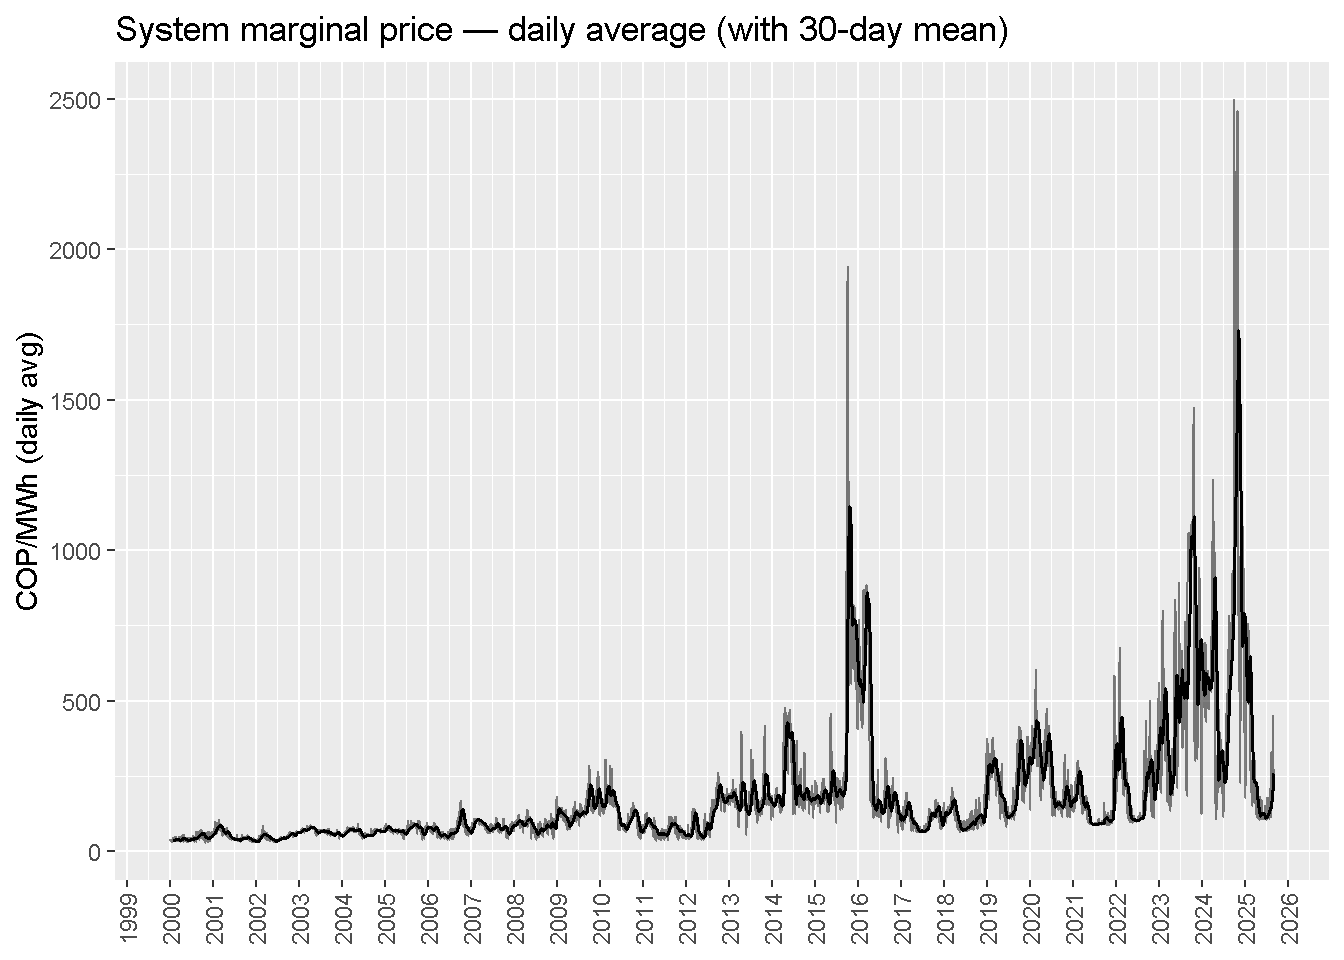
Daily SMP with 30-day trend
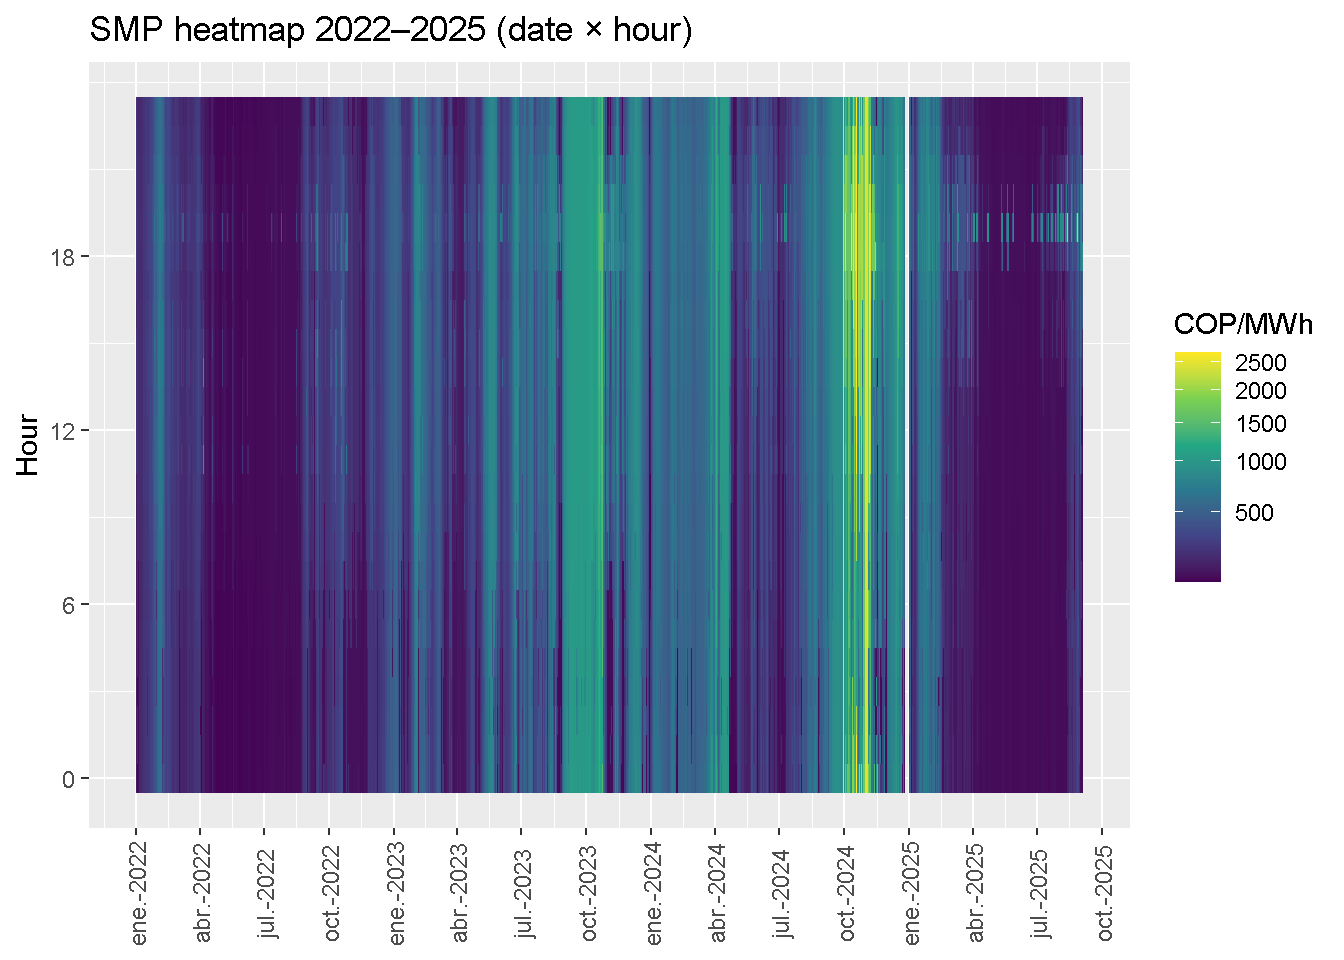
Calendar heatmap (hour × date)
Distribution & tails (hourly)
Rolling volatility of daily SMP (30-day)
Price-duration curves by year (daily)