Excercies
library(gcookbook)
library(ggplot2)
head(heightweight)
##   sex ageYear ageMonth heightIn weightLb
## 1   f   11.92      143     56.3     85.0
## 2   f   12.92      155     62.3    105.0
## 3   f   12.75      153     63.3    108.0
## 4   f   13.42      161     59.0     92.0
## 5   f   15.92      191     62.5    112.5
## 6   f   14.25      171     62.5    112.0
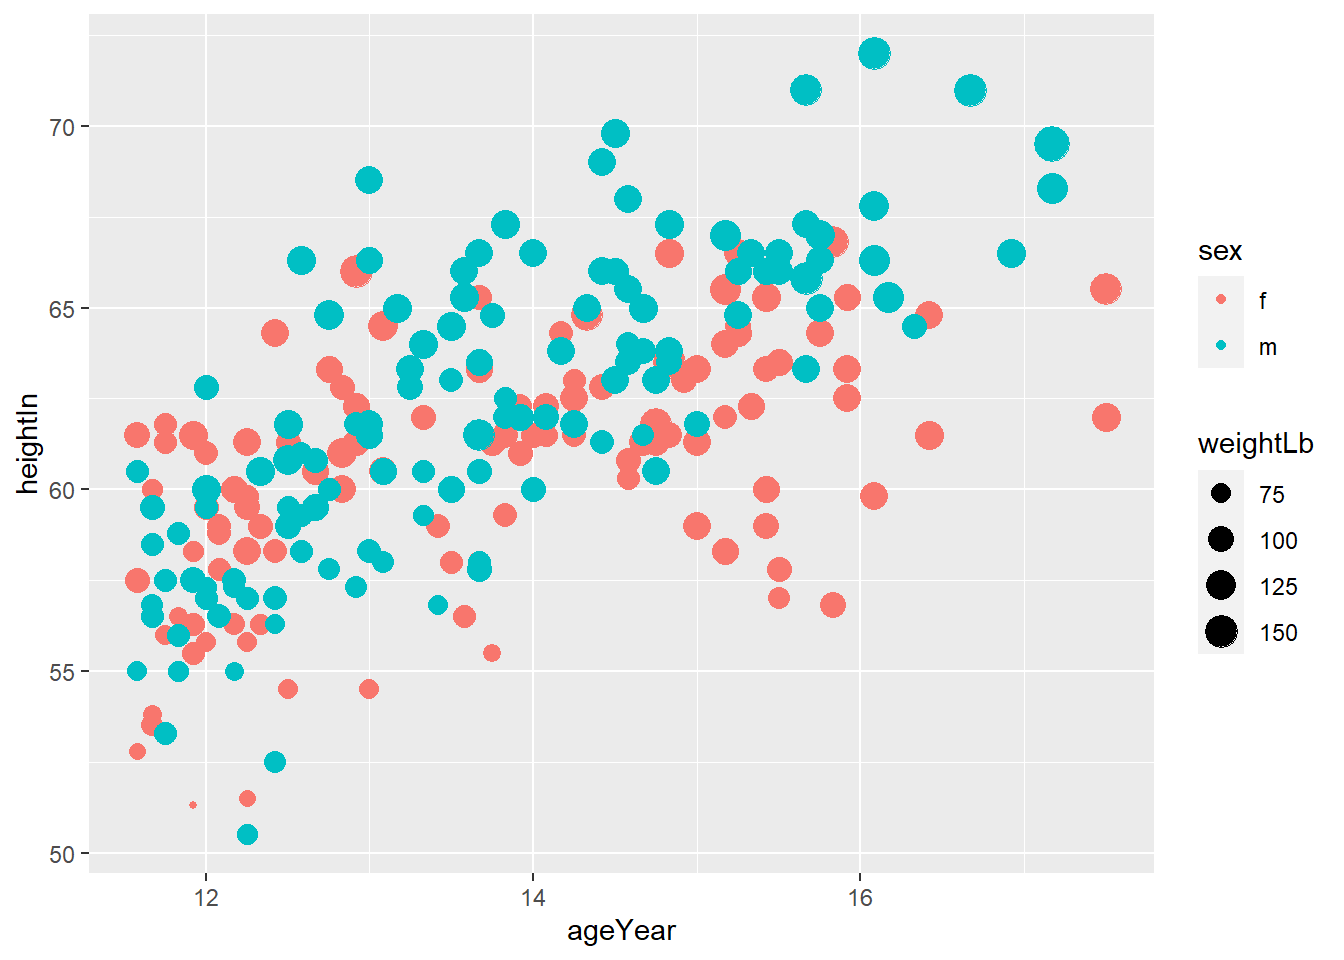
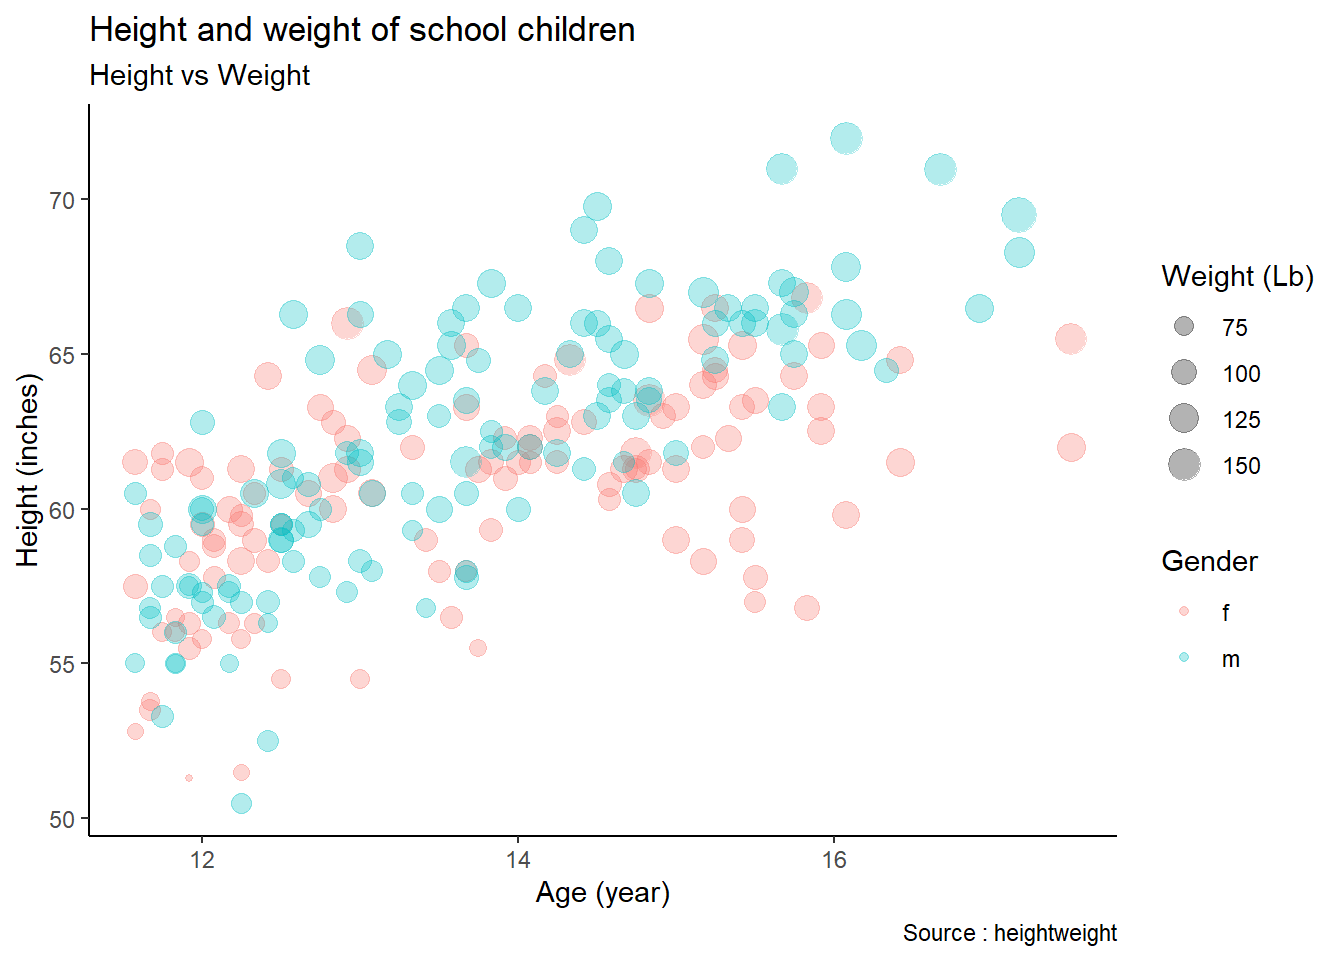
# 3-1-a
p <- ggplot(heightweight, aes(x = ageYear, y = heightIn)) +
  geom_point(aes(color = sex, size = weightLb))
p
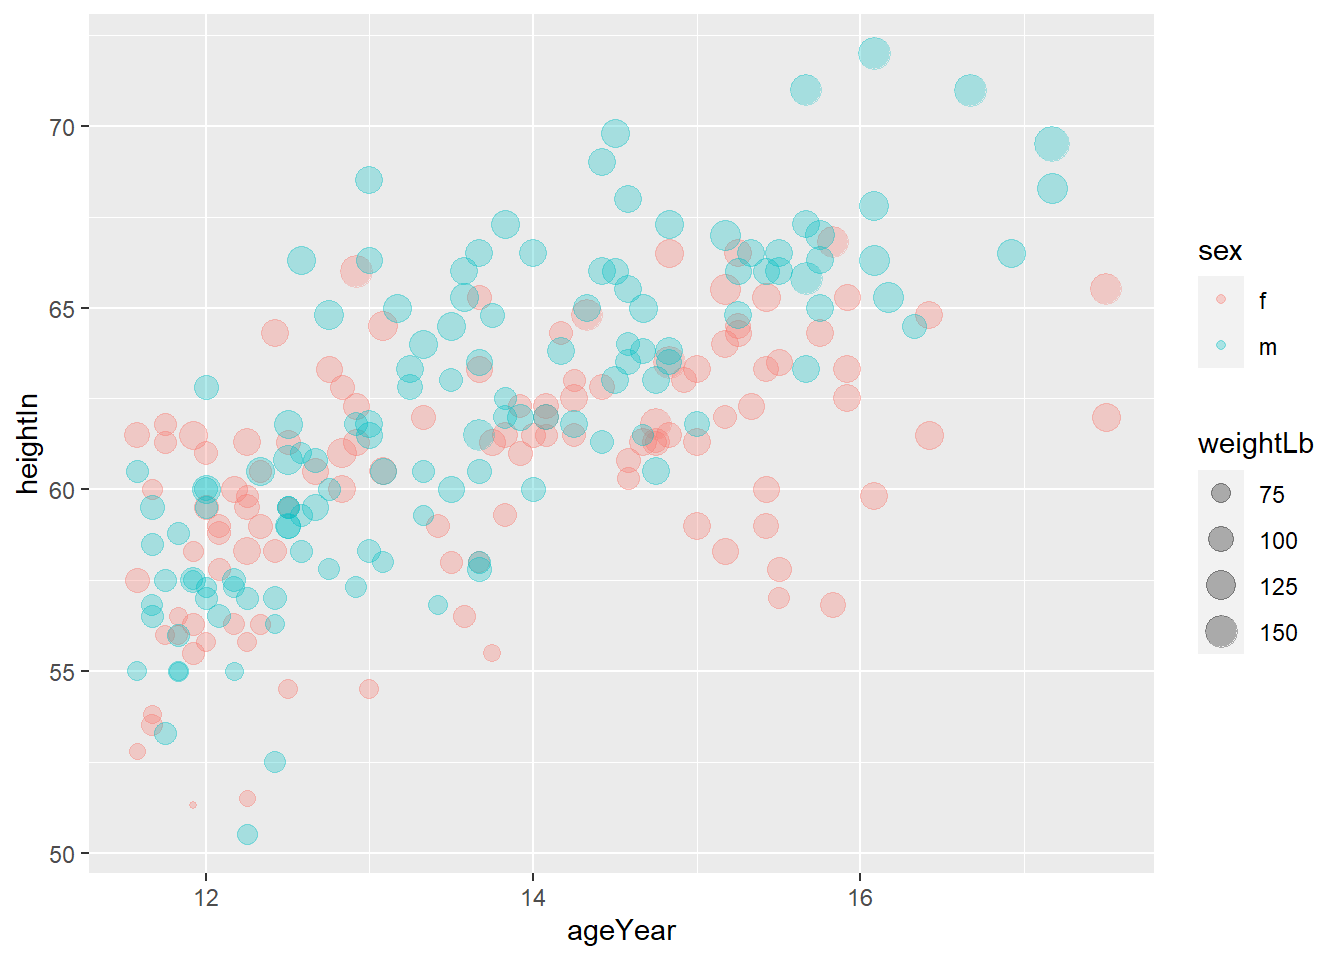
# 3-1-b
pp <- ggplot(heightweight, aes(x = ageYear, y = heightIn)) +
  geom_point(aes(color = sex, size = weightLb), alpha = 0.3)
pp
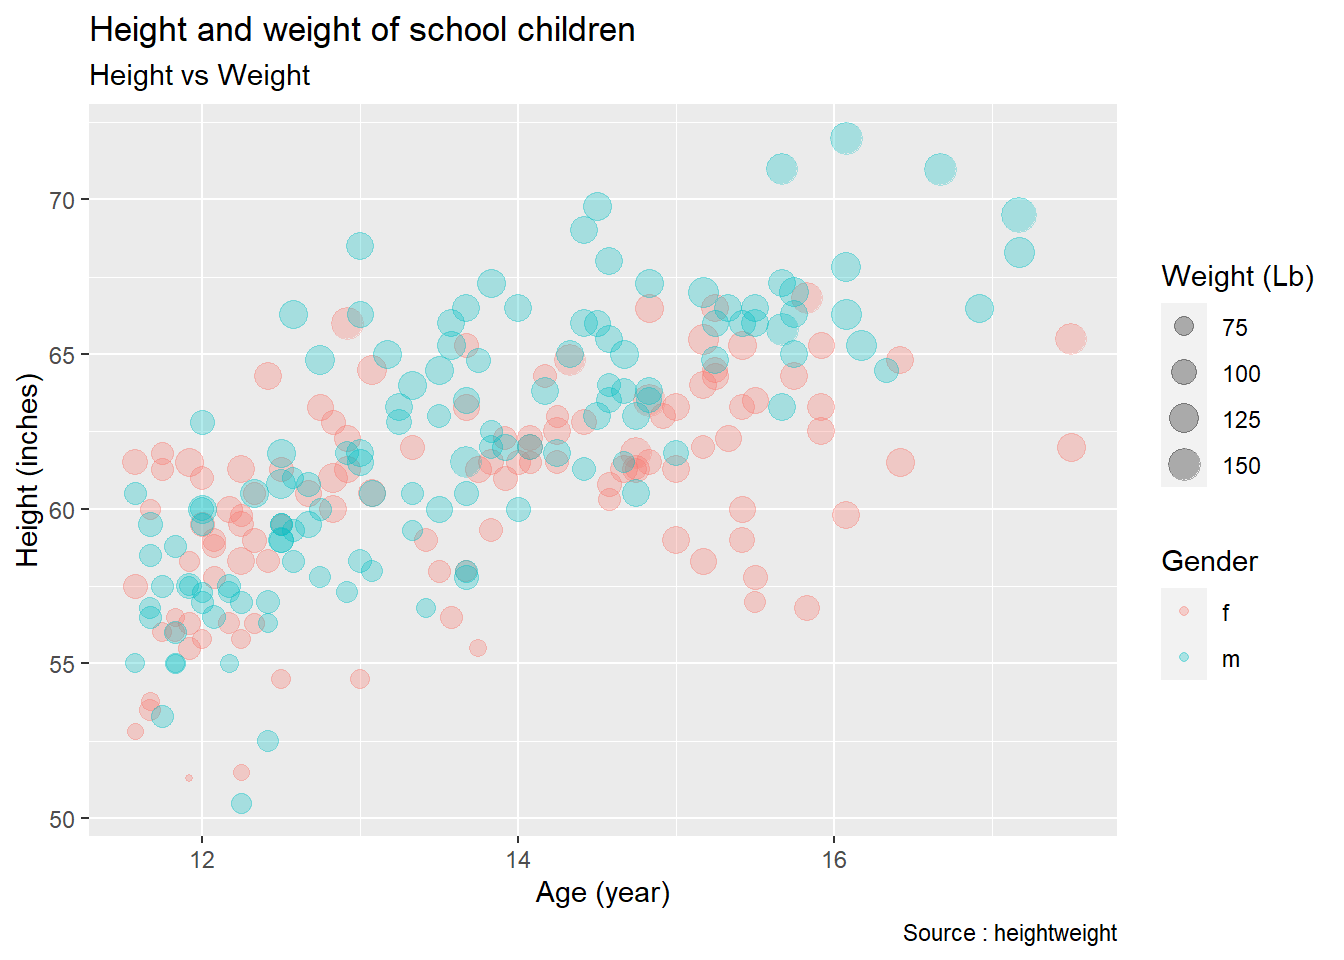
# 3-1-c
ppp <- pp +
  labs(title = "Height and weight of school children",
       subtitle = "Height vs Weight",
       caption = "Source : heightweight",
       x = "Age (year)",
       y = "Height (inches)",
       color = "Gender",
       size = "Weight (Lb)")
ppp
# 3-1-d
ppp +
  theme_classic()
##   sex ageYear ageMonth heightIn weightLb
## 1   f   11.92      143     56.3     85.0
## 2   f   12.92      155     62.3    105.0
## 3   f   12.75      153     63.3    108.0
## 4   f   13.42      161     59.0     92.0
## 5   f   15.92      191     62.5    112.5
## 6   f   14.25      171     62.5    112.0
# 3-2-a
p2 <- ggplot(heightweight, aes(x = heightIn)) +
  geom_histogram()
p2
## `stat_bin()` using `bins = 30`. Pick better value with `binwidth`.
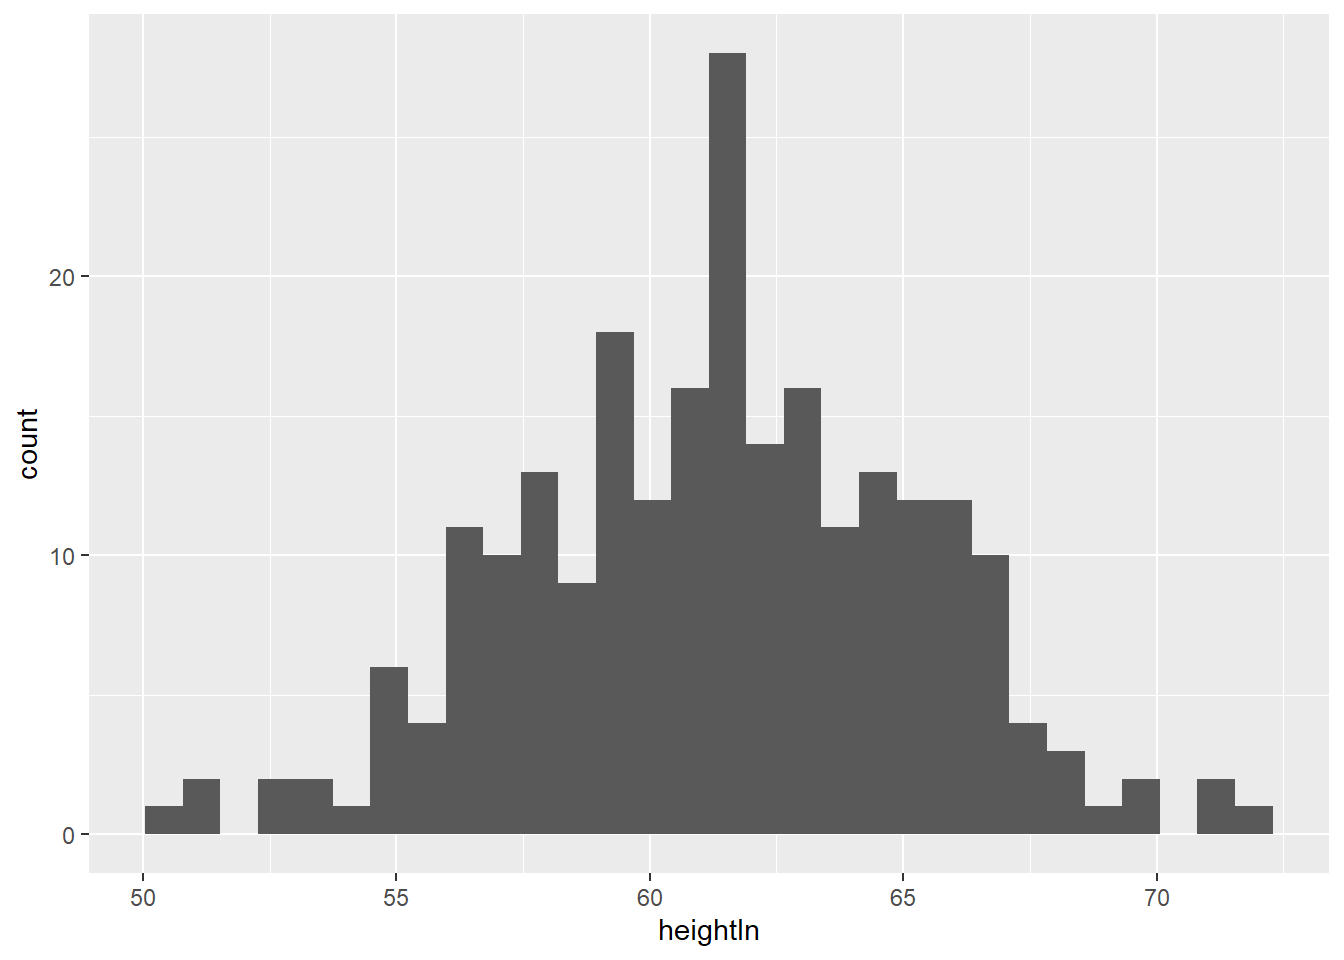
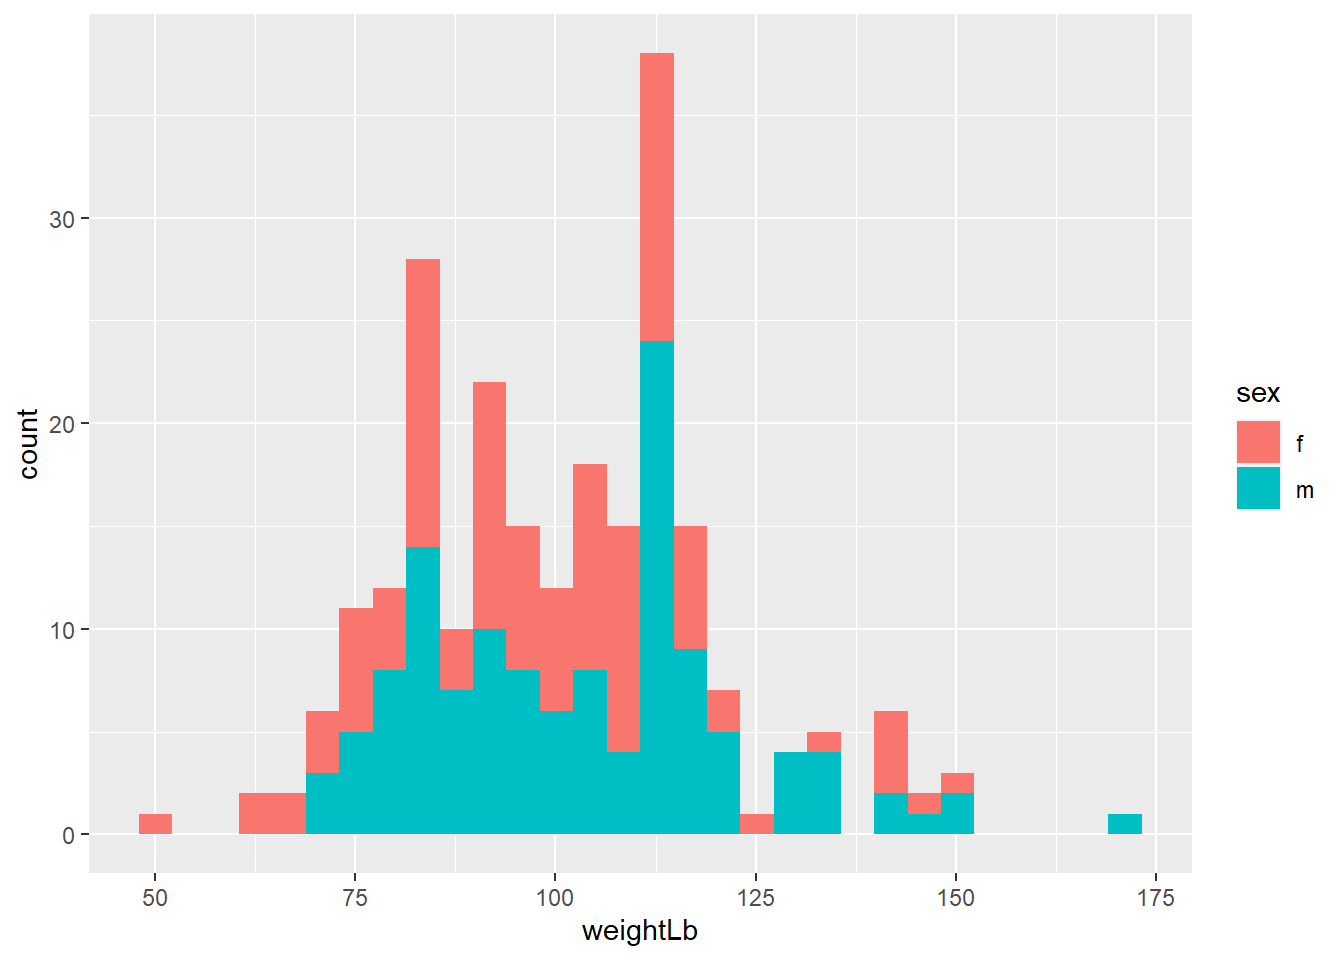
# 3-2-b
pp2 <- ggplot(heightweight, aes(x = weightLb, fill = sex)) +
  geom_histogram()
pp2
## `stat_bin()` using `bins = 30`. Pick better value with `binwidth`.
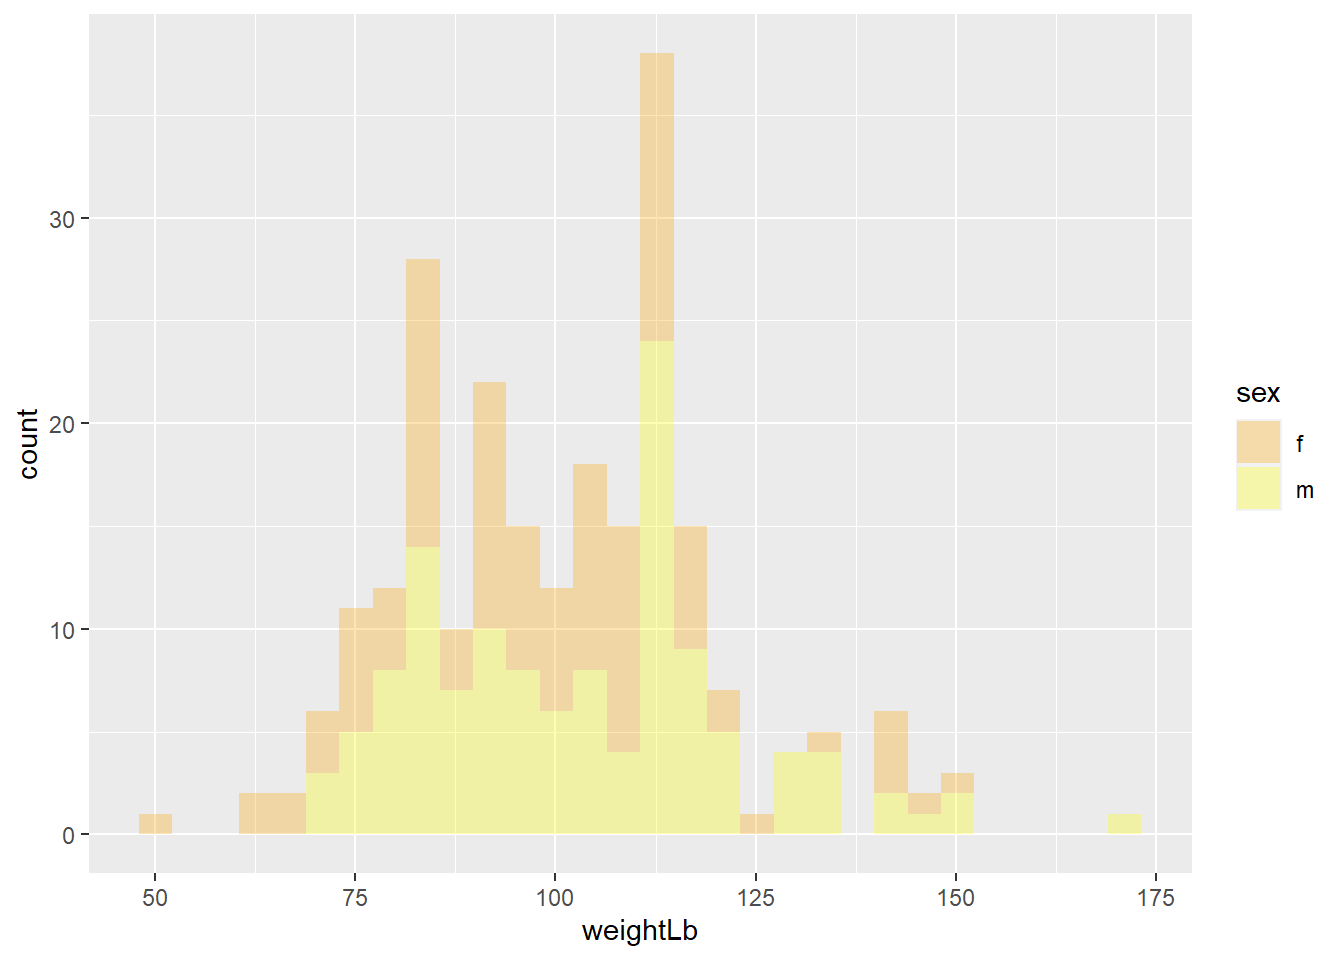
# 3-2-c
ppp2 <- ggplot(heightweight, aes(x = weightLb, fill = sex)) +
  geom_histogram(alpha = 0.3) +
  scale_fill_manual(values = c("orange", "yellow"))
ppp2
## `stat_bin()` using `bins = 30`. Pick better value with `binwidth`.
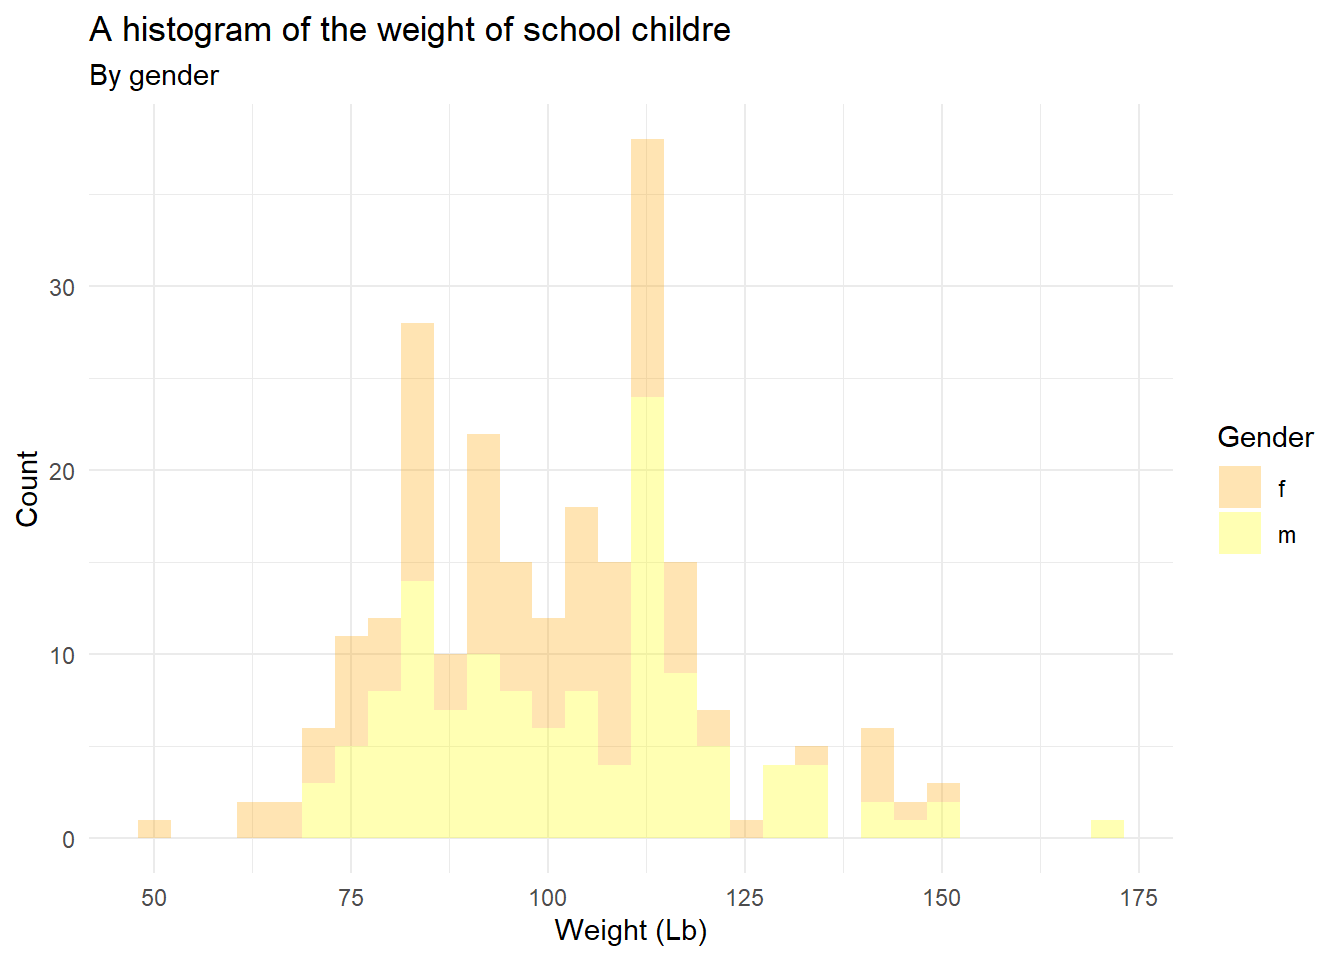
# 3-2-d
ppp2 +
  labs(title = "A histogram of the weight of school childre",
       subtitle = "By gender",
       fill = "Gender",
       x = "Weight (Lb)",
       y = "Count") +
  theme_minimal()
## `stat_bin()` using `bins = 30`. Pick better value with `binwidth`.