B Appendix B: Supplementary figures
![Study-specific quadratic associations between coffee consumption and all-cause mortality. The relative risks are presented on a log scale using 0 cups/day as referent [@crippa2016red].](thesis_files/figure-html/p-indiv-1.png)
Figure B.1: Study-specific quadratic associations between coffee consumption and all-cause mortality. The relative risks are presented on a log scale using 0 cups/day as referent (Crippa et al., 2016b).
![Empirical distributions for within-error terms for the study-specific linear trend in a dose--response meta-analysis between processed and red meat and bladder cancer risk [@crippa2016red].](thesis_files/figure-html/fig-dist-vi-1.png)
Figure B.2: Empirical distributions for within-error terms for the study-specific linear trend in a dose–response meta-analysis between processed and red meat and bladder cancer risk (Crippa et al., 2016b).
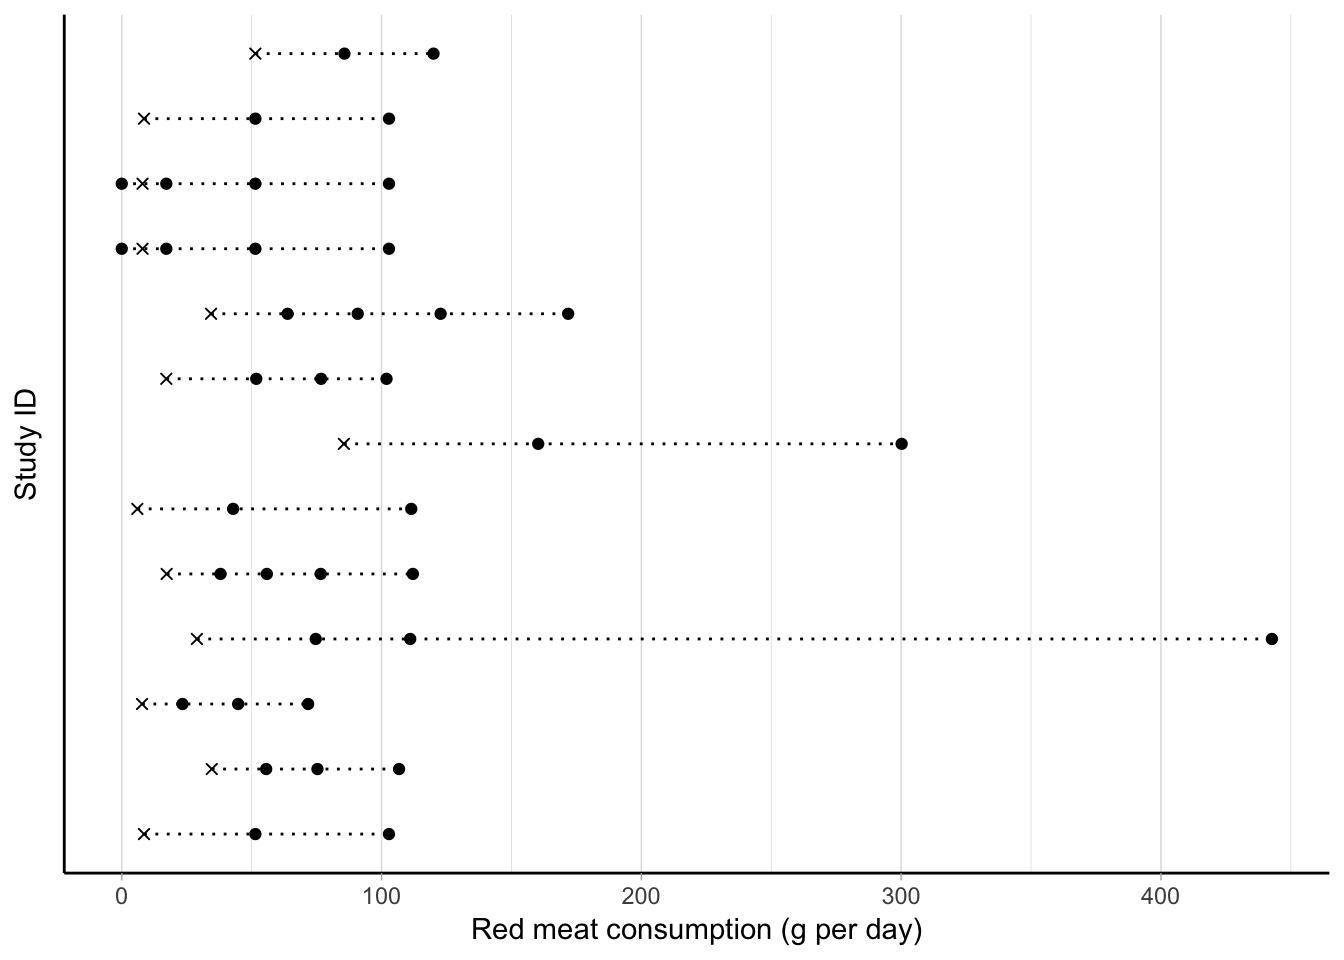
Figure B.3: Graphical visualization of the study-specific exposure distribution for 13 studies included in a dose–response meta-analysis between red meat consumption (g per day) and bladder cancer risk. The crosses and circles are, respectively, the referent and non-referent assigned doses of red meat consumption.
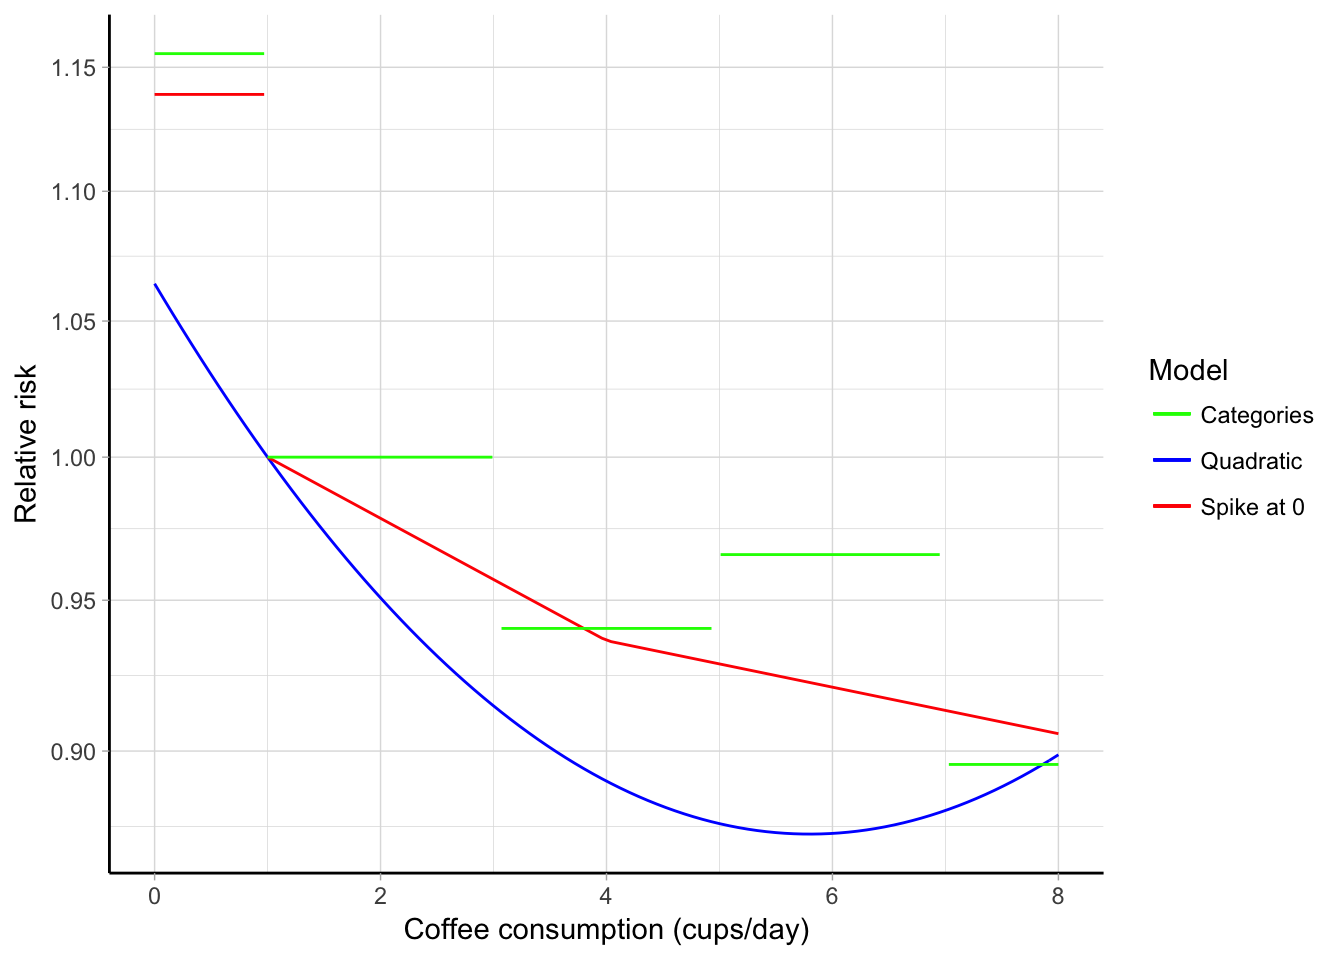
Figure B.4: Comparison of different strategies (quadratic, spike at 0, and categorical models) in a dose–response meta-analysis of coffee consumption (cups/day) and all-cause mortality. The relative risks are presented on the log scale using 1 cup/day as referent.
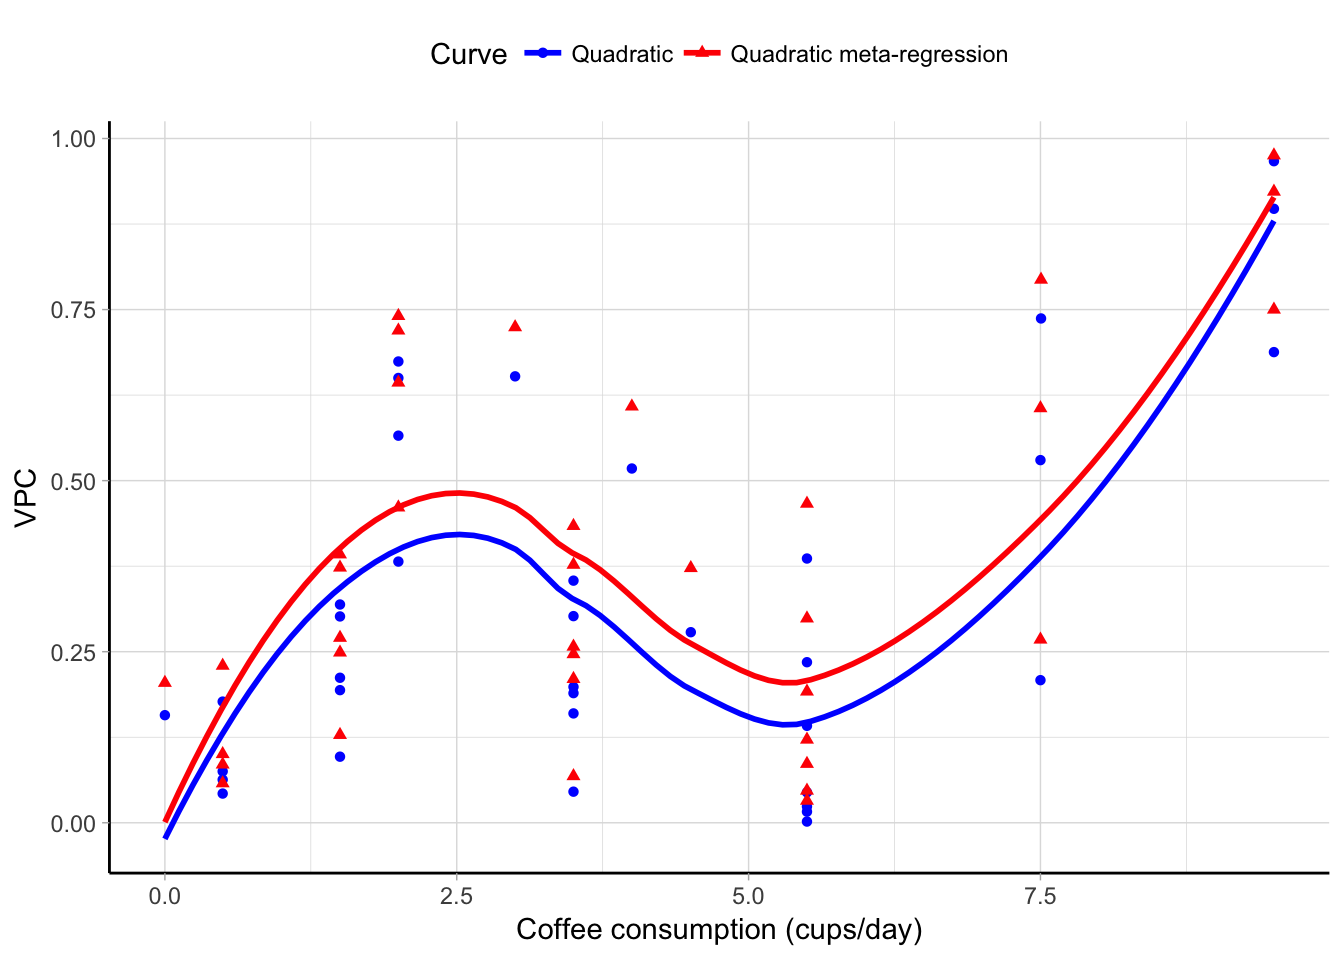
Figure B.5: Variance Partition Coefficient, \(\textrm{VPC}_{ij}\), versus observed dose levels plot and LOWESS smoother for dose–response meta-analysis between coffee consumption (cusp/day) and all-cause mortality using a quadratic and meta-regression model.