3 Example issues in full reports
As a prelude to the more comprehensive review, this section describes 8 sample reports that present notable challenges in clarity, accuracy, or significance. The following section places these examples in the context of reviews organized by how data, methods, analysis, results, and interpretation appear in the 56 full reports reviewed here.
3.1 Clarity and style in text, tables, and figures
3.1.1 Report mm6827a2 (Su et al. 2019)
2019-07-12; 68(27): 604-607. Workplace secondhand tobacco smoke exposure among U.S. nonsmoking workers, 2015.
In this report, staff of the National Institute of Occupational Safety and Health (NIOSH) analyze data from a NIOSH-sponsored component of the NCHS-coordinated National Health Interview Survey. The primary results concern the contrasts in workplace exposure to secondhand smoke between those with frequent exposure and those with any exposure. The report presents 16 industry categories and subcategories. For each of the 16 categories, the report tabulates the estimated percentage of workers, together with 95% confidence intervals (CIs), with any secondhand smoke exposure. Corresponding estimates of frequent secondhand smoke exposure are reported for a subset of 9 categories; for the other 7 categories, the result is given only as “NS”, meaning that the estimated prevalence in the latter group was “not significantly different from reference group” at the 0.05 significance level.
This report’s approach goes against preferred practices for presenting statistical inferences in at least 4 ways: First, point estimates and CIs should be presented for all 16 categories, not only those for which the contrast is on the wrong side of a binary cutoff. Second, since the report seeks to identify differences in exposure within industry categories, it should also include estimates for the contrasts in prevalence, such as the prevalence in the frequent-exposure group minus that in the any-exposure group, along with CIs for those differences. Third, the report should include P-values for each of those contrasts, not just a binary result. Finally, and most importantly, the report should go beyond listing industries with apparently significant difference in workplace exposure to secondhand smoke by interpreting or otherwise commenting on the magnitudes of those within-industry contrasts; without those assessments, a reader has a limited basis for seeing the public health relevance and significance of the currently implicit contrasts, much less the extent to which the differences might be attributed to a real phenomenon versus background sampling variation.
3.1.2 Report mm6841e3 (Siegel et al. 2019)
2019-10-18; 68(41): 919-927. Update: interim guidance for health care providers evaluating and caring for patients with suspected e-cigarette, or vaping, product use associated lung injury — United States, October 2019.
This summary follows up on the summary of report mm7039e3 (Budzyn et al. 2021) (below) and focuses on the sole figure in report mm6841e3 (Siegel et al. 2019). The figure contains 2 panels. The left panel contains bars with superposed intervals, depicting percentages with CIs (of persons needing intubation). The right panel contains bars with superposed intervals, depicting means with CIs (of number of days in hospital). The figure does not describe the methods for constructing the CIs. Some authors call this kind of graphic, where elements include error bars (segments with end caps) superposed on bars, “dynamite plots” (Irizarry, 2019). Empirical research shows that readers often misinterpret them.
Whereas readers often correctly interpret bar charts of counts, percentages, and counts per unit population, they frequently misinterpret these bar charts when coupled with error bars. Specifically, many readers exhibit “within-the-bar bias” (Pentoney and Berger 2016), in which they infer that values within the enclosed rectangle of the bar are more likely than values outside the bar. In the figure in this report, the issue is compounded by placing the lower limits of the error bars against the dark fill in the bars representing percentages, thereby obscuring them.
As mentioned above, readers have an even harder time with bars representing means of quantities other than counts. Thus, the righthand panel in the figure is even more challenging to interpret than the lefthand panel. The contents of each panel could be replaced by dot plots with error intervals, which have empirically demonstrated advantages over bar charts.
3.1.3 Report mm6924e1 (Czeisler, Tynan, et al. 2020)
2020-06-19; 69(24): 751-758. Public attitudes, behaviors, and beliefs related to COVID-19, stay-at-home orders, nonessential business closures, and public health guidance — United States, New York City, and Los Angeles, May 5–12, 2020.
This report summarizes results from web-based surveys of “attitudes, behaviors, and beliefs related to COVID-19, stay-at-home orders, nonessential business closures, and public health guidance” contrasted by geography (table 2: all United States, New York City, or Los Angeles) and by respondent characteristics (table 3: gender, age group, or ethnicity). The report does not adequately convey how the analysis accounted for a web-based convenience sample with a 59% response rate. Reported margins of error are not explained. Analytic methods are underexplained only as “chi-squared statistics”. And analytic methods and software are omitted; Jupyter Notebook is not analytic software but an environment that accommodates many analytic programs (including Julia, Python, and R, together giving Jupyter its name).
Tables 2 and 3 contain 108 significance test results, reporting 3 tests for each of 36 contrasts. Among those test results, P-values are reported as follows: 43 as “<0.05”, 1 as a quantified value <0.05, and 64 as quantified values >0.05 (either as “1.0” or with 4 decimal places). As presented, these results do not give the reader a basis for assessing the extent to which various contrasts are incompatible with a null hypothesis of no difference. Thus, beyond the ambiguities in its methodological issues, the report’s presentation of statistical inferences inverts preferred practices for presenting statistical inferences, in which, if P-values are reported, they should be most informative at lower values (e.g., <0.05 or 0.1). Thus, the report should have specified P-values under, say, 0.10 with 3 decimal places; values above 0.10 could have been expressed using 2 decimal places.
3.1.4 Report mm6939e2 (Leeb et al. 2020)
2020-10-02; 69(39): 1410-1415. COVID-19 trends among school-aged children — United States, March 1–September 19, 2020.
This report summarizes 6.5 months of Covid-19 cases, demographic characteristics, underlying conditions, hospitalizations, ICU admissions, and deaths among children, stating, “These results can provide a baseline for monitoring trends and evaluating mitigation strategies.” The report also says, “Analyses are descriptive; statistical comparisons were not performed.” The report omits structured inferences based on a probability model.
The second figure in this report, which superposes line graphs on stacked bars, runs afoul of at least 3 preferred practices for statistical graphics. First, by superposing elements that correspond to distinct vertical scales, the graphic sets up an arbitrary visual relationship between elements following one scale (line graphs for percentage positive, tracking 0-16 percent) in relation to elements following the other scale (stacked bars tracking total number of tests, tracking 0-350,000). Dual scales present a well-known problem with the potential to manipulate relationships, confuse a reader, or both. Furthermore, the quantities depicted do not have a direct relationship to each other; they encode different kinds of information related only through their connection to SARS-CoV-2 tests. Indeed, the line graphs independently depict percentages over time within 2 age groups, but the bar elements stack to depict cumulative frequencies over time. Second, the vertical axis on the left-hand side breaks between 16 and 100. This practice hypercorrects for the opposite consideration: that somehow a graphic depicting percentages is prone to manipulation if the scale does not include both 0 and 100. Third, by superposing line graphs on filled bars, the graphic makes it difficult to see the lines where they overlay bars, especially when rendered in grayscale.
3.1.5 Report mm7039e3 (Budzyn et al. 2021)
2021-10-01; 70(39): 1377-1378. Pediatric COVID-19 cases in counties with and without school mask requirements — United States, July 1–September 4, 2021.
This brief report (about 750 words with only 1 figure) presented an early look at apparent trends in Covid case counts among children, contrasting counties by requirements for masks in schools, with the primary intention to assess whether masking policies might have discernible impact on Covid epidemiology over a 2-month period—a causal evaluation.
As an attempt early in the pandemic, the report includes limited information in an evolving situation, in a limited number of counties over a limited time duration. This report raises at least 4 concerns regarding methods for analysis, presentation, and interpretation: First, the ecological, county-based analysis applies linear regression to case counts, adjusting for several county-level characteristics obtained from the American Community Survey and other sources. The authors do not explain their choice of a linear model rather than a loglinear model; nor do they reckon with the consequences of that choice. Second, the report presents the overall effect as follows: “After controlling for covariates, school mask requirements remained associated with lower daily case rates of pediatric COVID-19 (β = −1.31; 95% confidence interval = −1.51 to −1.11) (p<0.001).” Apart from noting a statistically significant negative association, the authors do not interpret the magnitude in terms of public health relevance or significance. The reader is not told, for example, if this result means that mask-requiring counties saw an average reduction of 1.3 pediatric cases (or cases per 100,000 children) per week compared to counties that did not require masks. In contrast, the authors do interpret other observed rate patterns earlier in the report. The authors go on to claim, “The results of this analysis indicate that increases in pediatric COVID-19 case rates during the start of the 2021–22 school year were smaller in U.S. counties with school mask requirements than in those without school mask requirements.”
Third, the graphical presentation in the figure violates several preferred practices for statistical graphics. Foremost, the graphic uses bars to represent differences of means, which could be negative. The field of data visualization has generally moved away from bar elements in most graphics, motivated by empirical evidence that readers misinterpret many kinds of bar charts—especially those representing means and those representing values that are not inherently positive. The graphic ambitiously attempts to set up for many contrasts in county-level case counts per unit population: between weeks before and after the start of school, between shorter and longer time durations, and between counties with and without school mask requirements. Nonetheless, the figure does not quantify the contrast between counties, which is the main effect of interest. An improved graphic, or set of graphics, would both avoid the flaws of bar charts for the intended effect and accommodate the contrasts of primary interest.
Fourth, the authors note that “this was an ecologic study, and causation cannot be inferred.” Nonetheless, they go on to state, “School mask requirements, in combination with other prevention strategies, including COVID-19 vaccination, are critical to reduce the spread of COVID-19 in schools. [emphasis added]” While this is an important talking point that might be supported by other data, it was not supported by the analysis in this report.
3.2 Accuracy and significance
3.2.1 Report mm7006e2 (Joo et al. 2021)
2021-02-12; 70(6): 212-216. Decline in COVID-19 hospitalization growth rates associated with statewide mask mandates — 10 states, March–October 2020.
This report applies a regression model and method rooted in econometric literature (Courtemanche et al. 2020). Report mm7010e3 (Guy et al. 2021) uses the same method. Although both reports interpret the regression model coefficient as the “percentage point change” between modeled time points, this interpretation does not follow mathematically from the stated model. Thus, the report is unable to state the public health interpretation and significance of the derived results.
3.2.2 Report mm705152a3 (Wanga et al. 2021)
2021-12-31; 70(5152): 1766-1772. Characteristics and clinical outcomes of children and adolescents aged 18 years hospitalized with COVID-19 — six hospitals, United States, July–August 2021.
In its discussion section, this report on clinical outcomes of children hospitalized with Covid-19 asserts strong claims about the value of Covid vaccination: “[T]his study demonstrates that unvaccinated children hospitalized for COVID-19 could experience severe disease and reinforces the importance of vaccination of all eligible children to provide individual protection and to protect those who are not yet eligible to be vaccinated. These data highlight the importance of COVID-19 vaccination for those aged ≥5 years and other prevention strategies to protect children and adolescents from COVID-19, particularly those with obesity and other underlying health conditions.” A similar statement appears in the opening paragraph: “[F]ew vaccine-eligible patients hospitalized for COVID-19 were vaccinated, highlighting the importance of vaccination for those aged ≥5 years ….” The analysis as presented does not support these claims, despite their public health significance.
The report opens by noting that vaccines were recommended for those 12 years and older in mid-May 2021 and for those 5-11 years as of early November 2021. The data cover children hospitalized during July and August 2021. Among 713 children admitted for Covid-19 without multisystem inflammatory syndrome, 441 were under age 12 years (hence ineligible for vaccine) and 272 were between 12 and 17 years (13 fully or partially vaccinated, 196 not vaccinated, and 63 unknown). No children aged 5-11 years were vaccinated.
Although the report goes on to contrast children’s characteristics by age group (table 2) and certain morbid conditions (table 3), no further analysis directly addresses vaccination status. Furthermore, this study contains no information about the health status and outcomes of nonhospitalized children by Covid status, age group, or comorbidity. Therefore, the study contributes nothing to the evidence regarding vaccination among children and hospitalization or other health outcomes—neither whether vaccinated children are more or less likely to be hospitalized nor whether, among hospitalized children, those who are vaccinated are more or less likely to experience comorbid (“underlying”) conditions. Thus, while the claims in the discussion might be borne out by other information, they are not supported by the report itself. The report might show “that unvaccinated children hospitalized for COVID-19 could experience severe disease”, but it does not link the occurrence or severity of that disease to vaccination status. This report might show that <95% of eligible hospitalized children were not vaccinated and therefore highlight the value of continuing to expand vaccine coverage, but it neither “reinforces the importance of vaccination of all eligible children to provide individual protection and to protect those who are not yet eligible to be vaccinated” nor “highlight[s] the importance of COVID-19 vaccination … to protect children and adolescents from COVID-19.”
3.2.3 Report mm7121e1 (Bull-Otterson et al. 2022)
2022-05-27; 71(21): 713-717. Post–COVID conditions among adult COVID-19 survivors aged 18–64 and ≥65 years — United States, March 2020–November 2021.
This report received substantial public engagement, in part because of its visual abstract. The topline message proclaimed, “The absolute risk difference between the percentage of case-patients and controls who developed an incident condition was 20.8 percentage points for those aged 18–64 years and 26.9 percentage points for those aged ≥65 years. This finding translates to one in five COVID-19 survivors aged 18–64 years and one in four survivors aged ≥65 years experiencing an incident condition that might be attributable to previous COVID-19.”
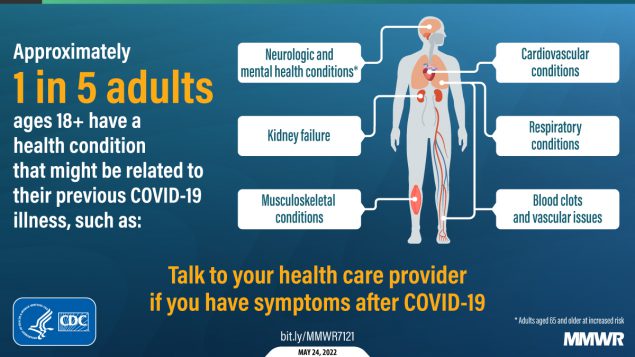
This message does not match the methods in the report, in that the time at risk (that is, over follow up from index date to event or terminal date) varies, and the analysis provides no information about the influence of this variable follow-up. The value that the report calls an “absolute risk difference” is instead a difference in cumulative incidence, which is not the same. The report should either state additional, strong hypotheses about differential follow-up or, better, apply analytic methods that are tailored for differential follow-up, namely time-to-event or survival methods. In contrast, 2 similar MMWR reports do use time-to-event methods: Report mm7102e2 (Barrett et al. 2022) uses IQVIA and HealthVerity data to assess risk for newly diagnosed diabetes in children, and report mm7131a3 (Kompaniyets et al. 2022) uses HealthVerity data to assess post-Covid symptoms and conditions among children.
Beyond the mismatch between methods and message, this report also asserts that, by subtracting the nominal frequency among control patients from the nominal frequency among case patients, the result yields the frequency of “incident conditions that might be attributable to previous COVID-19.” Despite acknowledgements of possible selection bias—where it might be more likely to find incident conditions in case-patients—and that the magnitude of the presented result is consistent with other literature, the topline claim is not directly supported by the analysis in this report.