4 Sensitivity Tests on Average Earnings
Following on from the last section I am going to assess the capacity of borrowers given the average wages. I am focusing on servicing the debt rather than assessing the asset they are purchasing. - Which I acknowledge requires it’s own due diligence. In part because granular data for this is behind a pay wall, I’ll not risk the potential privacy infringements.
I will assume 2025–26 resident brackets with Medicare levy 2%; include LITO phase-out to $66,667 (which will have small effect at AWOTE levels but included for accuracy) Low Income Tac Offset, ATO. I will consider 30% of net income a soft parameter for potential distress. The wage data I am using is flawed, it is not the median and I do not have a distribution. Savings and superannuation are not considered, this is a generalisation of affordability. - A sensitivity test rather than a stress test.
| Gross to Net Income | |||||
| date_lbl | gross_week | gross_annual | net_annual | avg_tax_rate | |
|---|---|---|---|---|---|
| Mining | 2025 May | 3174.5 | $165,074 | $119,357 | 27.7% |
| Information Media and Telecommunications | 2025 May | 2560.7 | $133,156 | $99,758 | 25.1% |
| Electricity, Gas, Water and Waste Services | 2025 May | 2366.8 | $123,074 | $92,902 | 24.5% |
| Professional, Scientific and Technical Services | 2025 May | 2327.6 | $121,035 | $91,516 | 24.4% |
| Financial and Insurance Services | 2025 May | 2323.7 | $120,832 | $91,378 | 24.4% |
| Public Administration and Safety | 2025 May | 2103.3 | $109,372 | $83,585 | 23.6% |
| Education and Training | 2025 May | 2098.3 | $109,112 | $83,408 | 23.6% |
| Health Care and Social Assistance | 2025 May | 1978.8 | $102,898 | $79,182 | 23.0% |
| Construction | 2025 May | 1957.6 | $101,795 | $78,433 | 23.0% |
| Transport, Postal and Warehousing | 2025 May | 1925.7 | $100,136 | $77,305 | 22.8% |
| Wholesale Trade | 2025 May | 1883.6 | $97,947 | $75,816 | 22.6% |
| Rental, Hiring and Real Estate Services | 2025 May | 1875.5 | $97,526 | $75,530 | 22.6% |
| Administrative and Support Services | 2025 May | 1818.4 | $94,557 | $73,511 | 22.3% |
| Arts and Recreation Services | 2025 May | 1802.5 | $93,730 | $72,948 | 22.2% |
| Manufacturing | 2025 May | 1788.7 | $93,012 | $72,460 | 22.1% |
| Other Services | 2025 May | 1521.2 | $79,102 | $63,002 | 20.4% |
| Retail Trade | 2025 May | 1504.4 | $78,229 | $62,408 | 20.2% |
| Accommodation and Food Services | 2025 May | 1459.7 | $75,904 | $60,827 | 19.9% |
The effective tax rates shown in the Gross to Net Income table (c. 23% at $100k, rising to ~28% at $165k) are relatively consistent with the legislated resident income tax schedule and Medicare levy, where marginal rates step from 30% above $45k to 37% above $135k and 45% above $190k Tax rates – Australian resident. The ATO’s Taxation Statistics provide overall average taxable income for all taxpayers, implying an overall average effective tax rate of ~32%, which includes lower earners and doesn’t isolate the $100–165k range ATO Individuals statistics for Taxation statistics 2022–23 (July 2025). While it may be on the lower end of what I expected net incomes to be, for the purpose of generalisation the tax rate calculated will suffice.
Recall the APRA Prudential Practice Guide from previous sections.
- Assessment buffer: ADIs must assess serviceability at the higher of:
- the loan’s interest rate + 3 percentage points, or
- an internal floor rate (7 to 8%). - Protecting against particularly low levels of interest.
- Income verification: stable income only, discounted if variable.
- Living expenses: must reflect borrower’s actuals where higher.
- Net Income Surplus (NIS): post-assessment income must remain positive.
New owner-occupier mortgage rates for new loans are currently sitting around the mid-5s: the RBA’s “Lenders’ rates” table shows 5.75% for owner-occupier new loans in June 2025 RBA. Advertised rates at the time of writing are about 5.35%. - Meeting in the middle interset rates of 5.5% are representative for the below. According to Cotality the average unit price nationwide is approx $835,000 Cotality - Home Value Index (July 2025). With ~50% of LVRs for Owner Occupied mortgages falling into the 60% to 80% bucket that would represent a 500k to 650k mortgage.
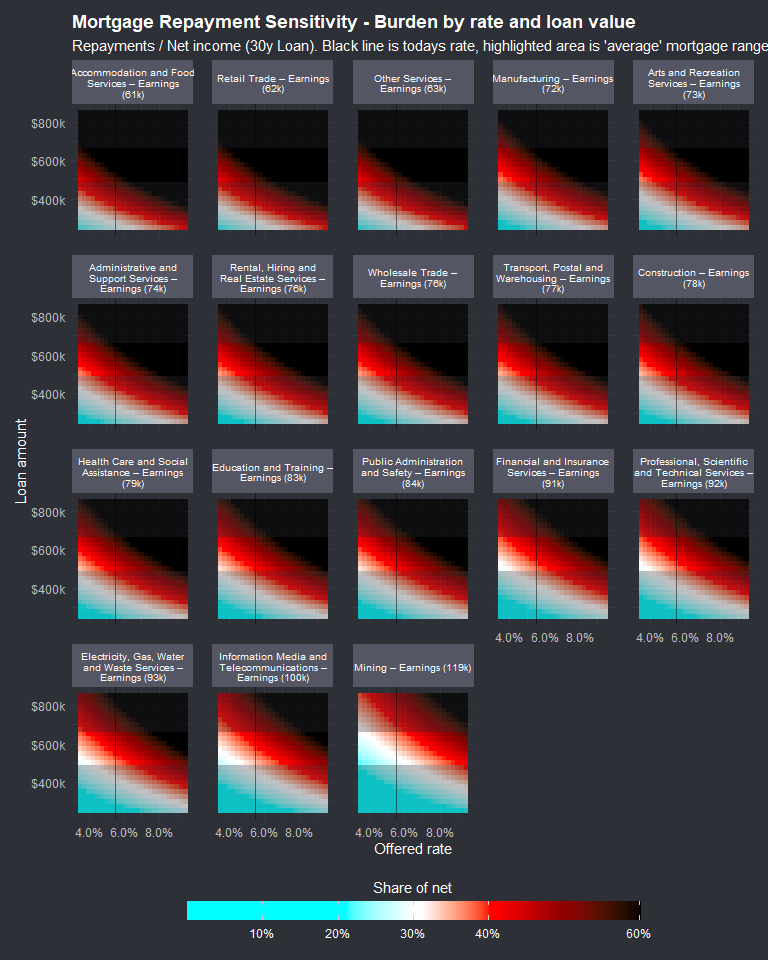
In the above sensitivity, the Miner is the only real candidate that can afford an average home. - At that, the 3% buffer means that they approach 40% of net income on mortgage repayments on a 500k loan. - Which would represent a 60% LVR on the average property nationwide.
Owners with a mortgage are predominantly couple households; one-person mortgagors are a small minority of mortgaged households. The RBA notes that dual-income mortgages feature prominently in liaison and stress analysis, consistent with couple dominance among mortgage holders RBA - FSR (September 2024).
Household size, existing debt, savings/asset buffers and likely bank specific serviceability specifics all come in to play for a genuine stress test. Without making a generalisation example trivial in the absence of micro data, I will move.