Chapter 2 Experiments and results
2.1 Data loading and preprocessing
The first step has been to load the dataset into the R workspace. A summary of the resulting data frame allows to extract some important preliminar information:
##      Name            Release.Year  Phase..  IMDb.rating      RT.rating
##  Length:41          Min.   :2008   1: 6    Min.   :5.200   Min.   :4.700
##  Class :character   1st Qu.:2015   2: 6    1st Qu.:6.900   1st Qu.:7.900
##  Mode  :character   Median :2019   3:11    Median :7.300   Median :8.700
##                     Mean   :2018   4:18    Mean   :7.271   Mean   :8.459
##                     3rd Qu.:2021           3rd Qu.:7.800   3rd Qu.:9.200
##                     Max.   :2022           Max.   :8.400   Max.   :9.800
The MCU currently consists of a total of 41 films, spanning from 2008 to 2022. The number of projects developed in each phase differs, with Phases One and Two containing six films each, Phase Three containing 11 films, and Phase Four containing 48 projects. The lowest critic rating for a MCU film is 4.7 for “Eternals” (2022) in Phase Four, while the lowest public rating is 5.2 for “She-Hulk” (2022) also in Phase Four.
2.2 Visual analysis techniques
Once the data is loaded and processed, some visual techniques can be applied in order to form a global picture of its structure, and obtain some hints towards possible further explanations. A histogram for both types of ratings (general public - IMDb, and professional critics - RT) is shown in figure 2.1. The results show that the data may not come from the same distribution, and therefore have different mean and standard deviation. This can be checked later using hypothesis tests.
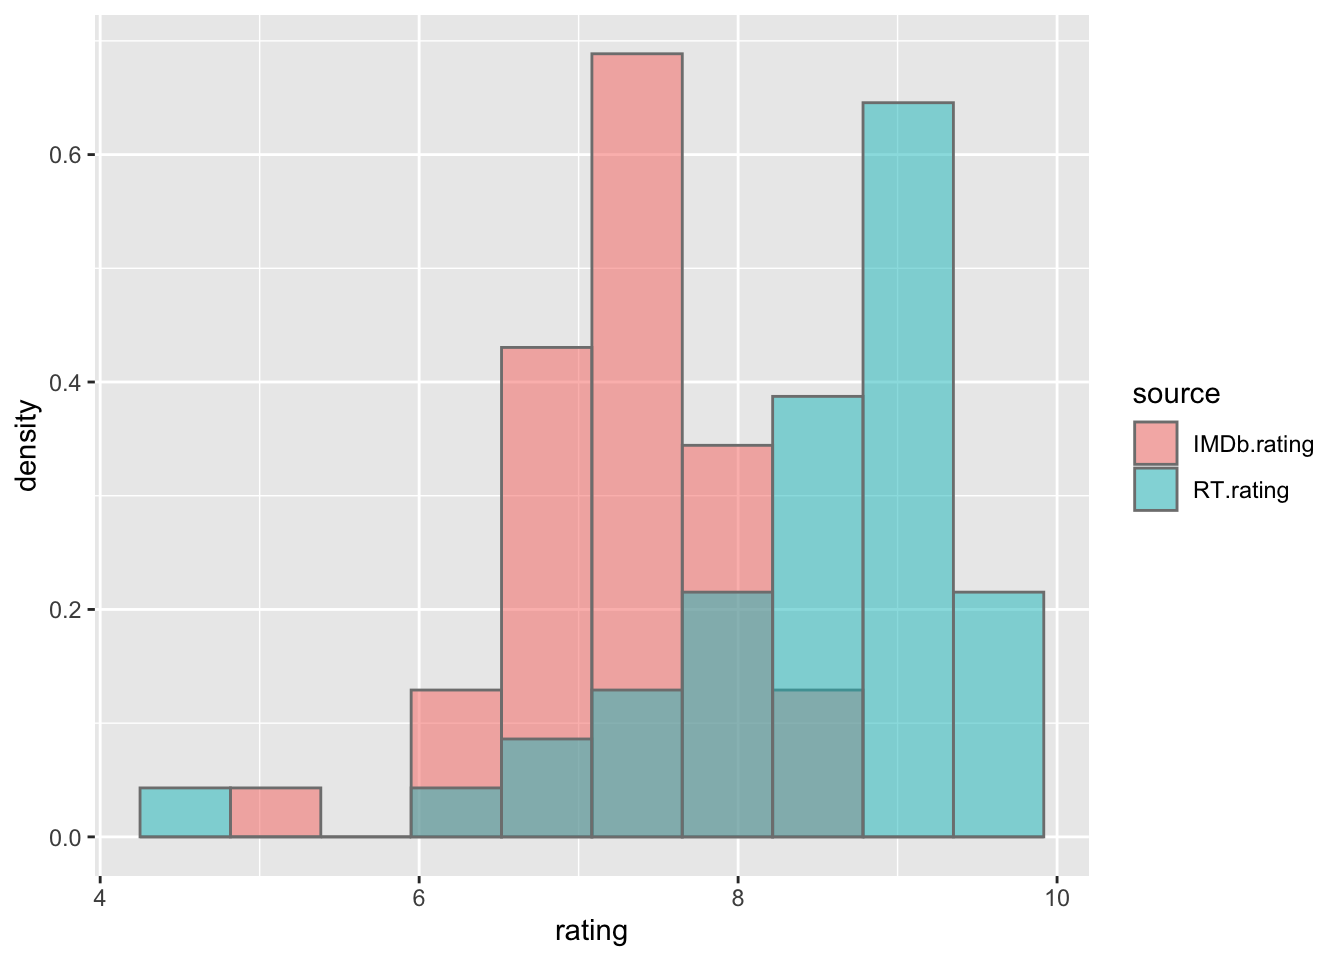
Figure 2.1: Histogram of the IMDb and RT ratings
A histogram of the general public ratings for each phase is shown in figure 2.2. It can be interpreted that, for each phase, the distribution is somewhat similar, with the exception of Phase 4, that seems more spread out.
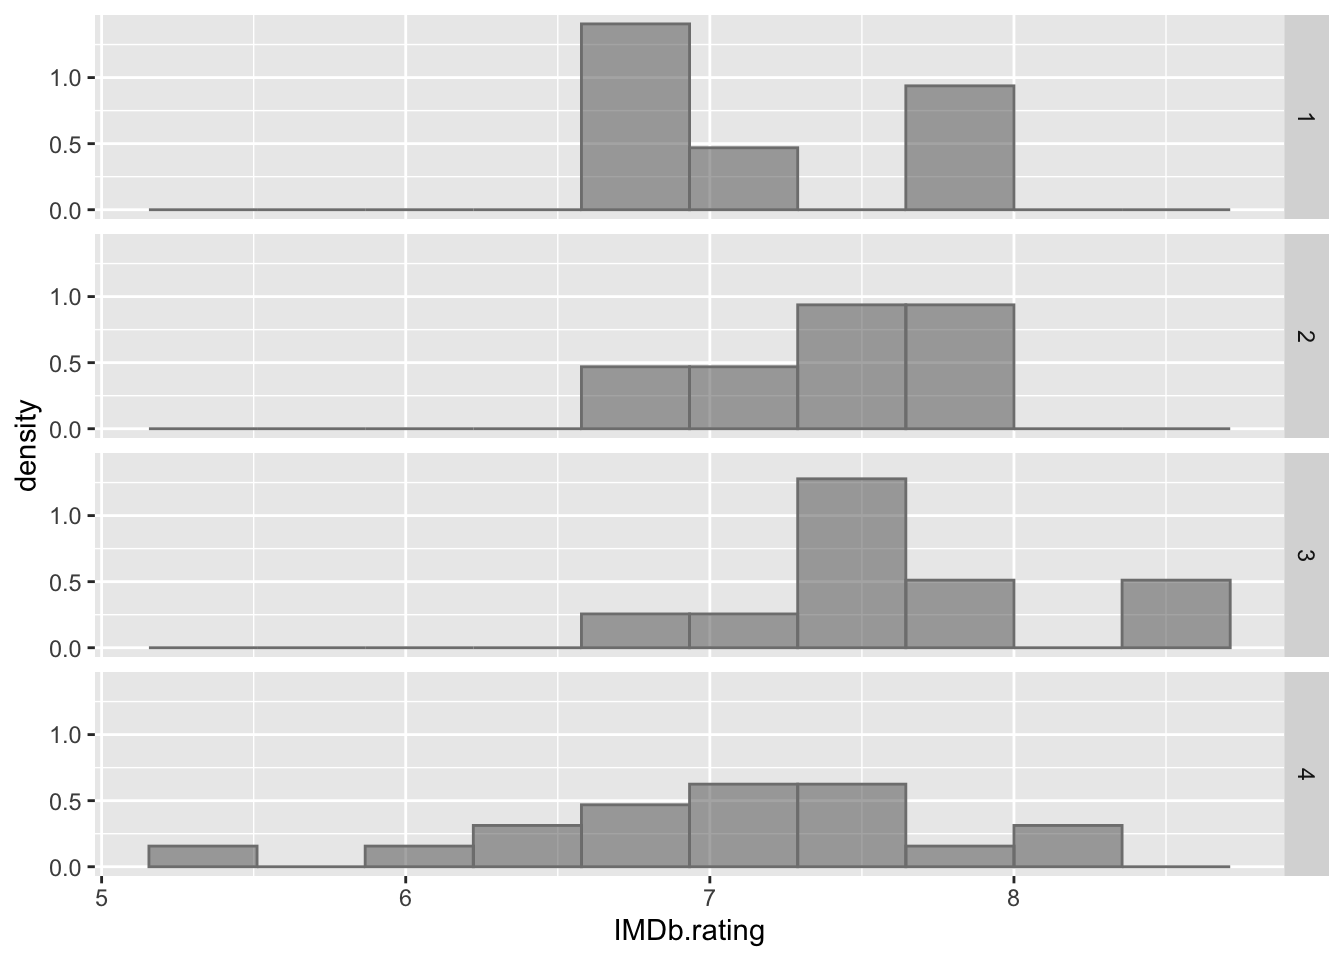
Figure 2.2: Histogram of IMDb ratings grouped by Phase.
A Shapiro Test has been performed to the IMDb and Rotten Tomatoes ratings in order to check if the assumption that they come from a normal distribution holds. The obtained p values are, respectively, 0.2066 and 0.0001202. This means that the null hypothesis can be rejected in the second case, while the first one is unclear.
The same test is performed independently for each Phase. The resulting p values are shown in table 2.1. It is shown that almost all values lead to not rejecting the null hypothesis, with the exception of IMDb ratings of Phase 1 and Rotten Tomatoes ratings of Phase 4. In order to use the same estimators and procedures for comparing phase results, no normality assumption will be held in the following.
| Phase | IMDb | RT |
|---|---|---|
| 1 | 0.1044 | 0.5736 |
| 2 | 0.7258 | 0.8098 |
| 3 | 0.6238 | 0.7989 |
| 4 | 0.5376 | 0.0009141 |
A boxplot for each Phase and rating source is presented in figure 2.3. Two remarks can be done after looking at the results. The first is that that professional ratings (RT) tend to have qualitatively higher values. The second one is the presence of outliers: Eternals (2021) and Thor: Love And Thunder (2022) in the case of critics reviews and She-Hulk (2022) in the case of the public. This leads to two interesting thoughts: firstly, the fact that there exist projects belonging to Phase 4 with significantly worst ratings may be behind the assumption that there has been a decrease in quality over the last few years. However, this thought cannot be generalized to the whole lot of projects released since 2019. Secondly, the fact that She-Hulk received poorer ratings from the general public may indicate a possible attempt at boycotting the series, deliberately assigning poor reviews in order to worsen its performance.
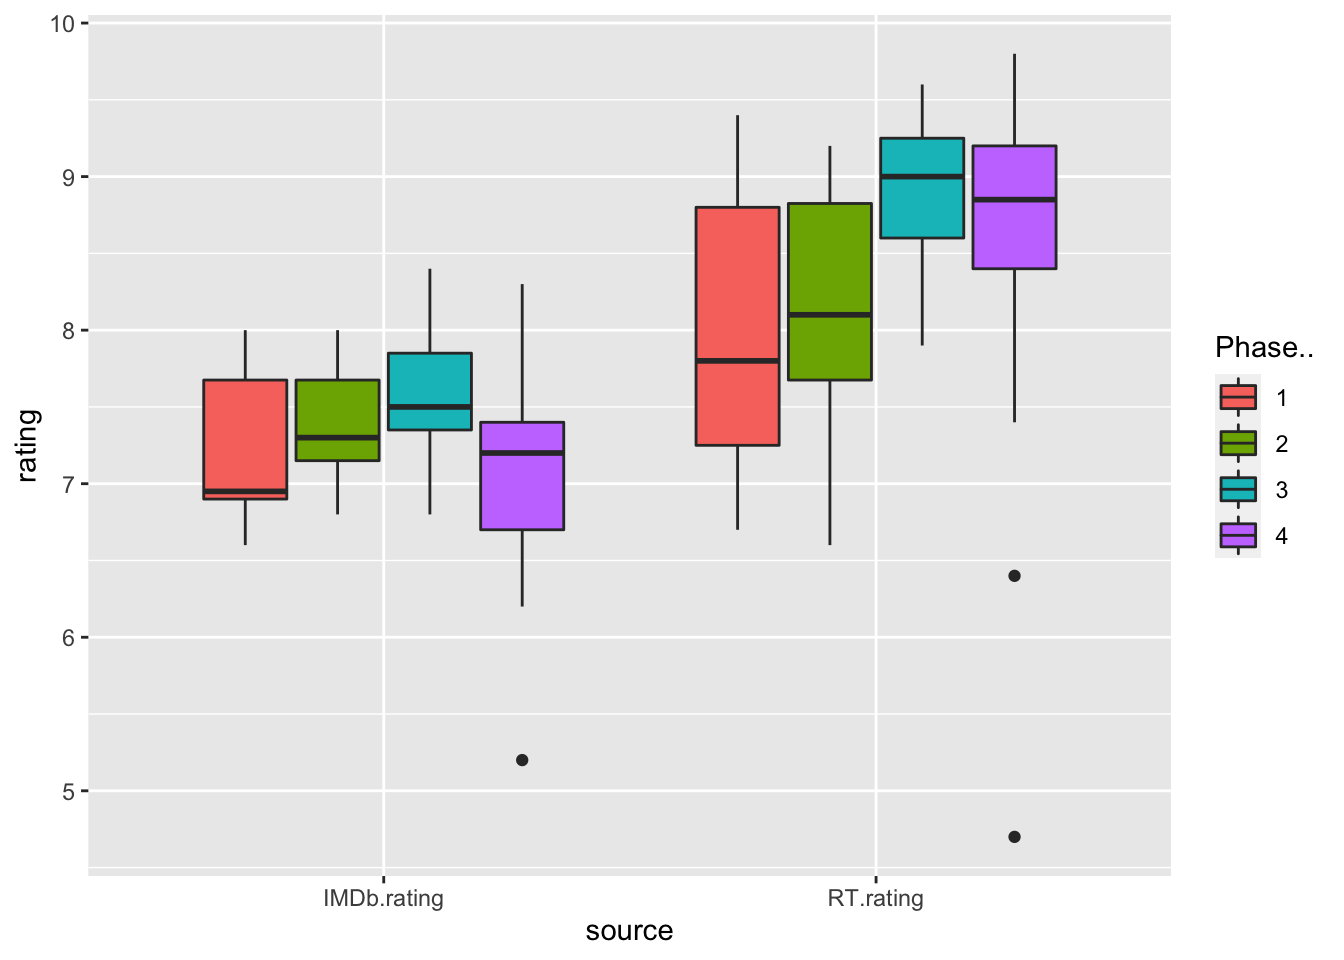
Figure 2.3: Boxplot of the ratings grouped by source and phase.
Finally, a plot the mean rating for each release year is shown in figure 2.4. No particular trend is appreciated for the first years by visually inspecting the output. However, a slow decrease in ratings may be hinted from year 2016 onwards for both IMDb and RT ratings.

Figure 2.4: Scatter plot of the mean rating for each year.
2.3 Parameter estimation
2.3.1 Sample mean for the IMDb and RT ratings with 95% Confidence Interval
A sample mean for both general public and film critic ratings has been performed using the Bootstrap method with \(n_B = 100\) bootstrap samples. This has been chosen in order to avoid any inductive bias related to the underlying distribution. The results are shown in table 2.2 and figure 2.5. Note that the confidence intervals do not overlap, which hints a possible significant difference between IMDb and RT ratings.
| Source | Mean | Lower Bound | Upper Bound |
|---|---|---|---|
| IMDb | 7.27 | 7.03 | 7.46 |
| Rotten Tomatoes | 8.46 | 8.14 | 8.81 |
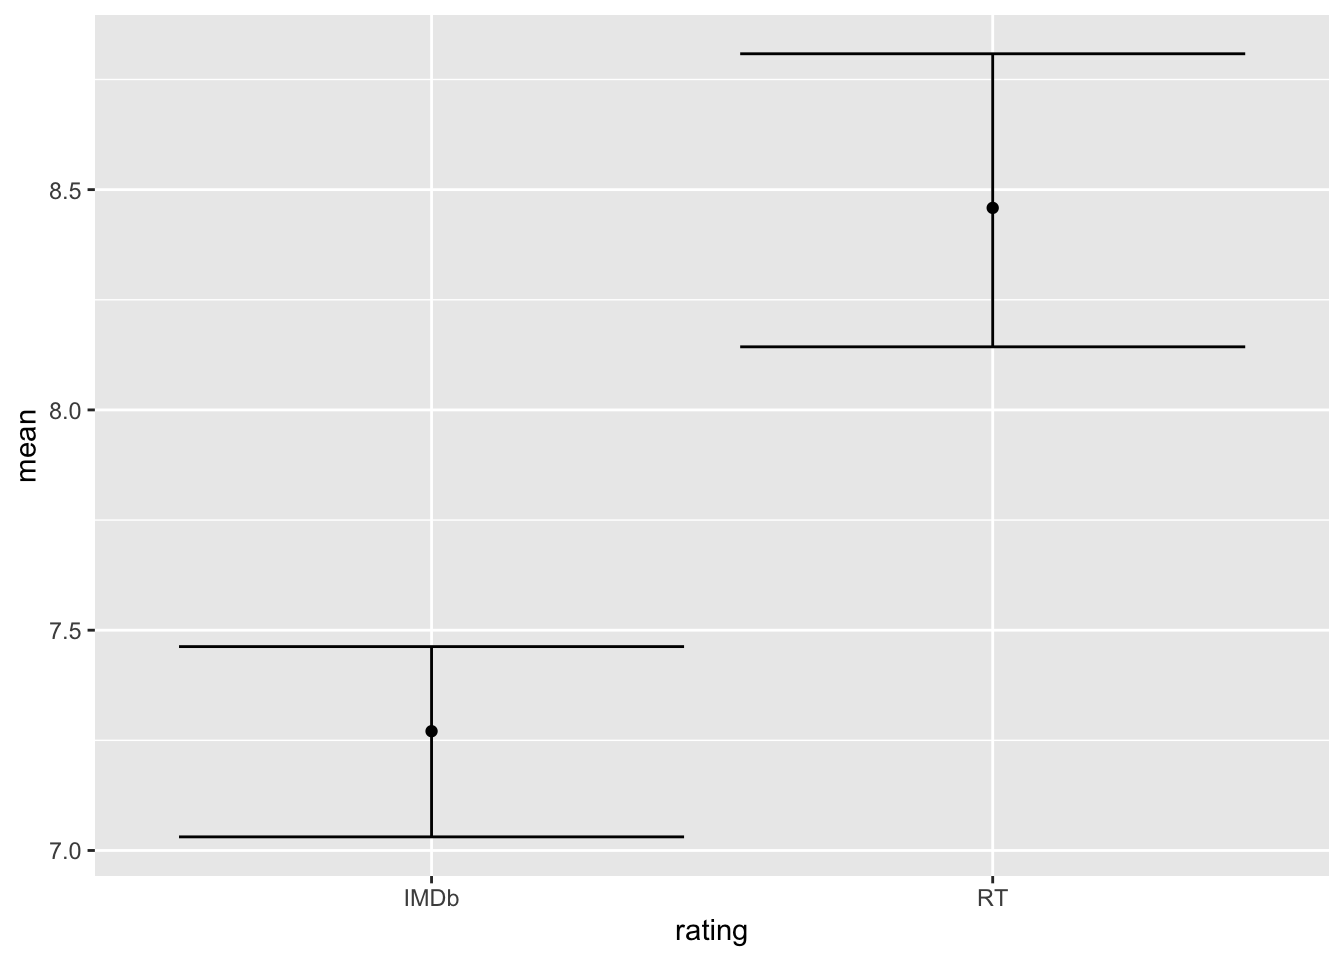
Figure 2.5: Mean rating for IMDb and RT sources
The same analysis has been performed independently for each phase, with the results that appear in table 2.3 and figure 2.6. Without taking into account the confidence intervals, it can be seen that Phase 4 is the highest rated by both film critics and the public, whilst Phase 4 comes in second for the professional critics but last for the general public. However, this differences may not be substantial.
| Source | Phase | Mean | Lower Bound | Upper Bound |
|---|---|---|---|---|
| IMDb | 1 | 7.216667 | 6.766667 | 7.633333 |
| IMDb | 2 | 7.383333 | 7.076115 | 7.638322 |
| IMDb | 3 | 7.590909 | 7.223335 | 7.871511 |
| IMDb | 4 | 7.055556 | 6.657042 | 7.385915 |
| RT | 1 | 7.983333 | 7.276115 | 8.888322 |
| RT | 2 | 8.100000 | 7.354460 | 8.733333 |
| RT | 3 | 8.909091 | 8.575160 | 9.240301 |
| RT | 4 | 8.461111 | 7.739104 | 8.926291 |
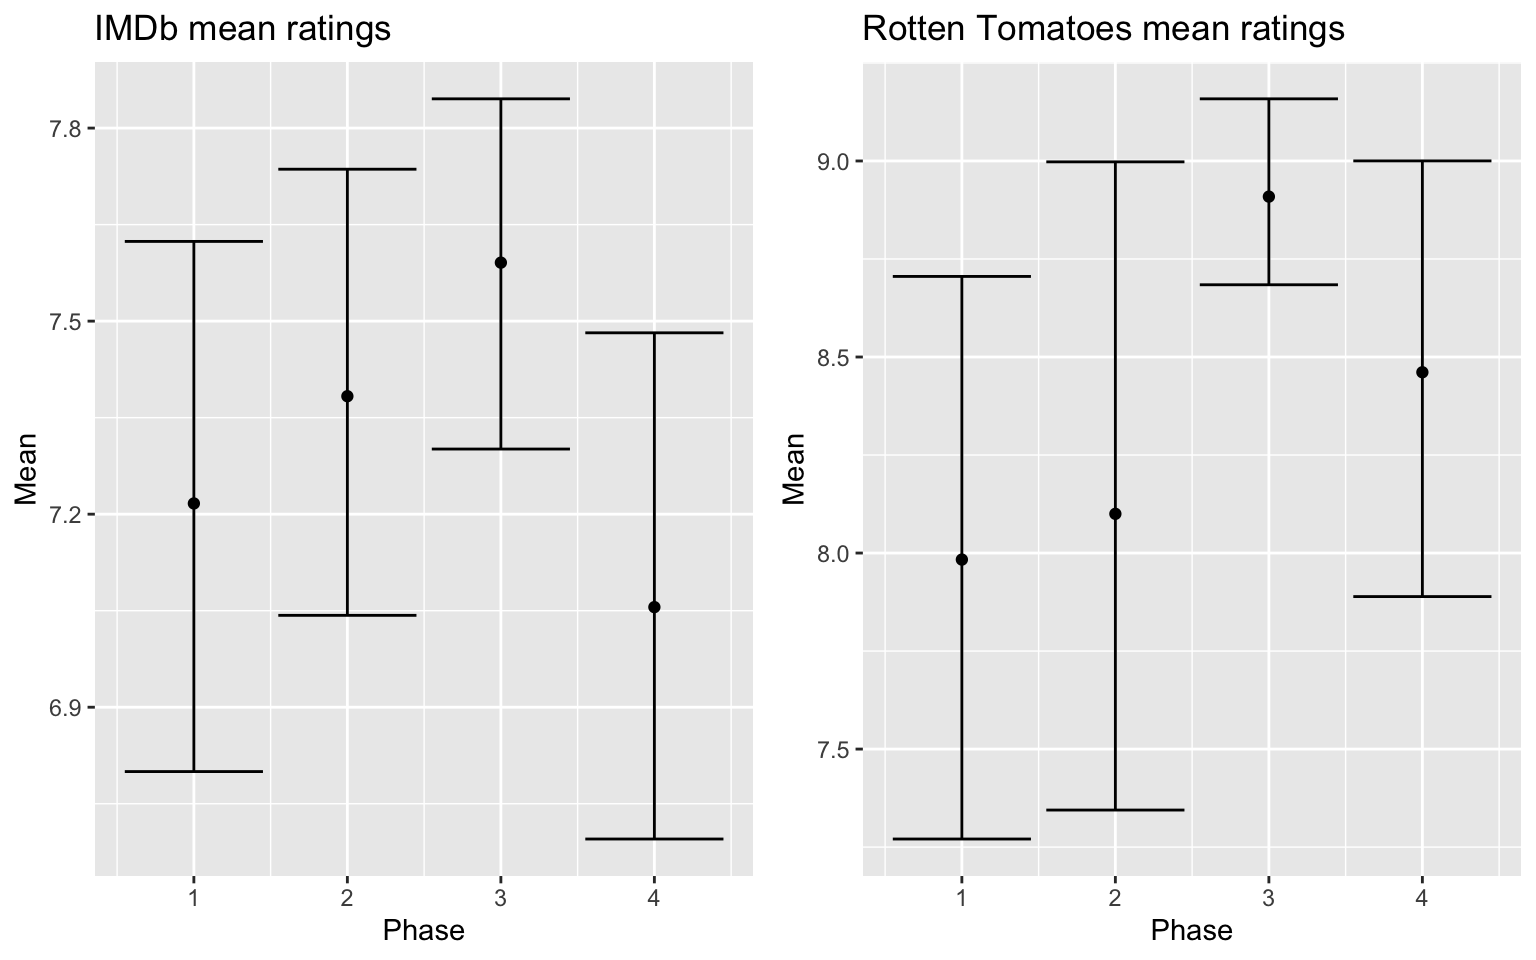
Figure 2.6: Mean rating for IMDb and RT sources
2.4 Hypothesis tests
Sections 2.2 and 2.3 helped in building a reference of the structure of the data and led to some preliminary analysis; however, they were qualitative and lacked the necessary numerical evidence. This section aims to revisit some of the statements made so far and confirm or deny them with the use of hypothesis tests. Consequently, every subsection will be named after the question or hypothesis that is under the scope.
2.4.1 Is the mean of the critics higher than the mean of the public ratings?
In order to properly answer this question, a test on the difference of means with unknown and different variances (t-test) has been performed. The null hypothesis states that the difference between the means is equal to 0, while the alternate hypothesis in this case is that the mean of the professional critics is higher. In this case, as the ratings for each source have a third variable in common (the movie that they refer to), the test must be paired. The results for the test are shown below:
##
##  Paired t-test
##
## data:  marvel$IMDb.rating and marvel$RT.rating
## t = -8.5403, df = 40, p-value = 7.432e-11
## alternative hypothesis: true mean difference is less than 0
## 95 percent confidence interval:
##        -Inf -0.9536113
## sample estimates:
## mean difference
##       -1.187805
Such a low p-value leads to rejecting the null hypothesis and confidently state that the mean rating of the MCU movies is higher for film critics than for the general public. This may happen because professional movie critics tend to follow objective criteria when analyzing a product, in contrast to the general public, which tends to be more subjective and passional. This way, a movie journalist will be able to evaluate objective aspects of a movie they dislike, while a casual viewer will simply write a bad review if they are not satisfied with the product.
This reasoning leads to questioning whether the general public is more or less consistent when rating movies than cinema journalists. With this in mind, an F test on the ratio of the variances has been performed. The null hypothesis this time is that the ratio between the variance of the IMDb and the RT ratings \(\dfrac{\sigma_{IMDb}^2}{\sigma_{RT}^2}\) is equal to 1, and the alternate hypothesis is that this ratio is different than 1 (a two-sided test). The results are again shown below:
##
##  F test to compare two variances
##
## data:  marvel$IMDb.rating and marvel$RT.rating
## F = 0.39557, num df = 40, denom df = 40, p-value = 0.004171
## alternative hypothesis: true ratio of variances is not equal to 1
## 95 percent confidence interval:
##  0.2109507 0.7417797
## sample estimates:
## ratio of variances
##          0.3955742
Again, the obtained p-value for a ratio value of 0.3955742 is close to 0 and the null hypothesis can be rejected. Therefore, it can be stated that ratings for the movie critics have a higher variance than the ones for the general public. A possible explanation is that, as every rating is in itself a sample mean, the variance of each value can be higher as the sample size is lower in the case of professional critics. However, this could also mean that the general public is more consistent when rating MCU movies.
2.4.2 Is the mean of the Phase 4 ratings lower than the other Phases?
Visual analysis and parameter estimation have not yet lead to a strong conclusion about this question. In order to shed a light into the topic, cross two-sided t-tests for each pair of phases have been performed. This time, the tests are not paired as the data come from different films and share no common variable. The results can be found in tables 2.4 and 2.5. Following the standard criterion for rejecting the null hypothesis (\(p_{value} < \alpha = 0.05\)) would lead to not being able to find any significant difference between the different phases for neither rating source. Therefore, in a rigorous way, it cannot be assured than Phase 4 (or any phase) has different mean rating than the rest. However, the adequacy of the proposed acceptance level could be discussed. For example, a value of \(\alpha = 0.1\) would imply that the pairs formed by Phase 3 - Phase 4 (IMDb), Phase 1 - Phase 3 (RT) and Phase 2 - Phase 3 (RT) have different means, which indicates that Phase 3 has (possibly) significantly better ratings than the rest.
In all cases, there are no strong evidences to assure that Phase 4 is significantly worse than the rest of the instances of the MCU.
| Phase x | Phase y | Mean x (IMDb) | Mean y (IMDb) | p-value |
|---|---|---|---|---|
| 1 | 2 | 7.216667 | 7.383333 | 0.5914 |
| 1 | 3 | 7.216667 | 7.590909 | 0.219 |
| 1 | 4 | 7.216667 | 7.055556 | 0.5993 |
| 2 | 3 | 7.383333 | 7.590909 | 0.4 |
| 2 | 4 | 7.383333 | 7.055556 | 0.2169 |
| 3 | 4 | 7.590909 | 7.055556 | 0.03109 |
| Phase x | Phase y | Mean x (RT) | Mean y (RT) | p-value |
|---|---|---|---|---|
| 1 | 2 | 7.983333 | 8.100000 | 0.8467 |
| 1 | 3 | 7.983333 | 8.909091 | 0.09104 |
| 1 | 4 | 7.983333 | 8.461111 | 0.386 |
| 2 | 3 | 8.100000 | 8.909091 | 0.09786 |
| 2 | 4 | 8.100000 | 8.461111 | 0.712618 |
| 3 | 4 | 8.909091 | 8.461111 | 0.1828 |
2.5 Trend Analysis
The last question posed in section 1.2 “Is there any trend on the ratings (increasing or decreasing)?” can be easily studied using a linear regression, and testing the nulity of its coefficients. This has been done for both IMDb and RT ratings, and the results are shown in figures 2.7 and 2.8. As expected, both the p-value for the coefficients and the \(R^2\) metric are neglectable, and there is not a significant trend in the ratings. However, the decreasing trend starting 2016 observed during visual analysis might be tested in a separate way, as shown in figures 2.9 and 2.10. This time, the coefficients are much more significant and the trend is clearly present, specially in the RT case. This leads to conclude that the critics have been decreasing their MCU ratings since 2016.
##
## Call:
## lm(formula = mean_IMDb ~ Release.Year)
##
## Residuals:
##      Min       1Q   Median       3Q      Max
## -0.71499 -0.39858  0.04458  0.26065  0.64740
##
## Coefficients:
##               Estimate Std. Error t value Pr(>|t|)
## (Intercept)  -0.730280  57.535353  -0.013    0.990
## Release.Year  0.004017   0.028552   0.141    0.891
##
## Residual standard error: 0.4225 on 11 degrees of freedom
## Multiple R-squared:  0.001796,   Adjusted R-squared:  -0.08895
## F-statistic: 0.0198 on 1 and 11 DF,  p-value: 0.8906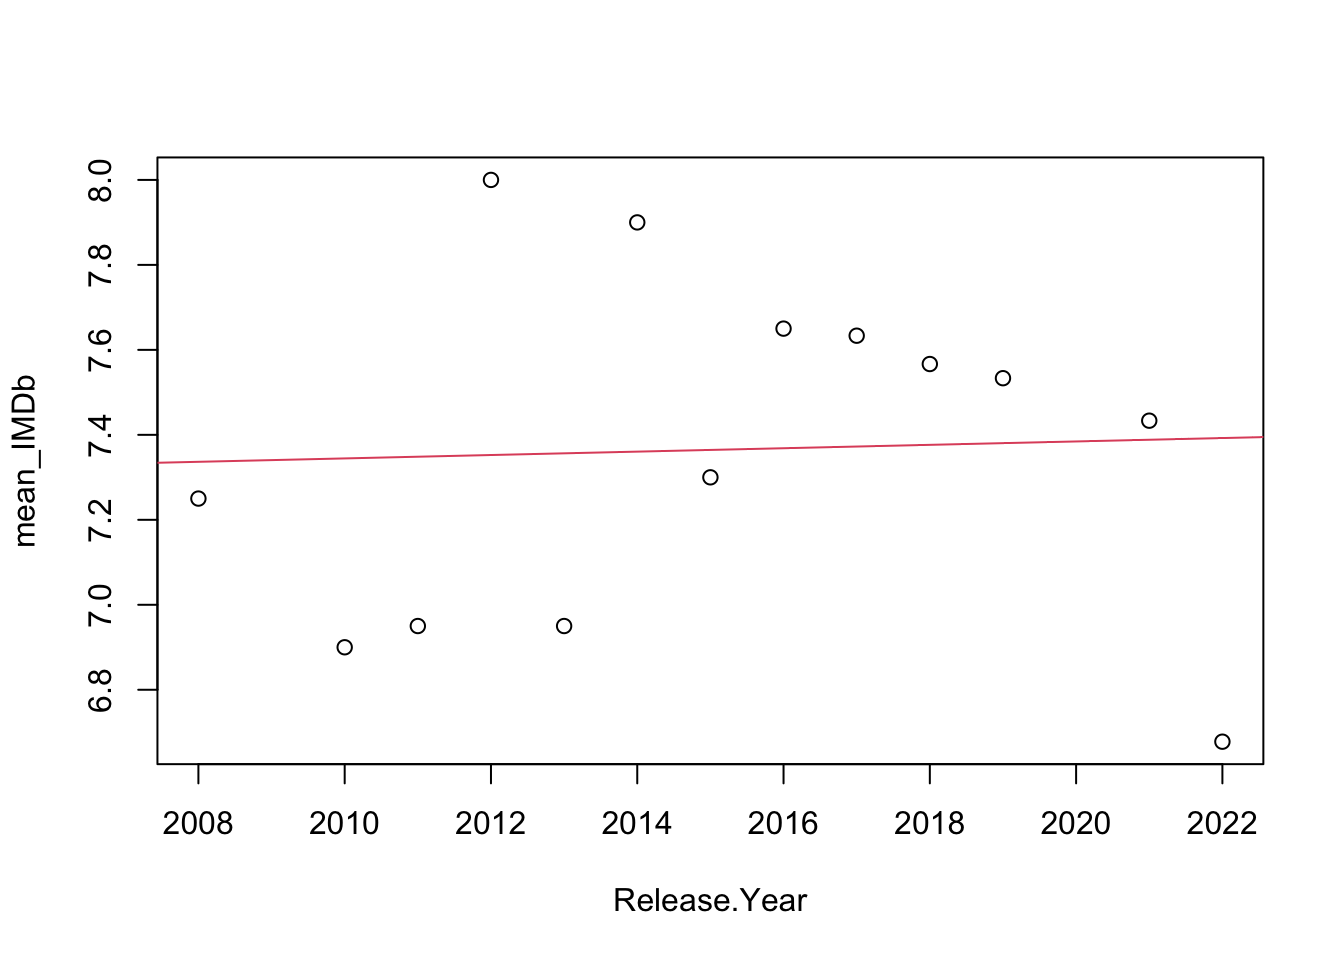
Figure 2.7: Trend line for the IMDb ratings.
##
## Call:
## lm(formula = mean_RT ~ Release.Year)
##
## Residuals:
##      Min       1Q   Median       3Q      Max
## -0.97242 -0.42285  0.09297  0.47673  0.95279
##
## Coefficients:
##                Estimate Std. Error t value Pr(>|t|)
## (Intercept)  -143.18089   87.32560  -1.640    0.129
## Release.Year    0.07521    0.04334   1.736    0.111
##
## Residual standard error: 0.6412 on 11 degrees of freedom
## Multiple R-squared:  0.215,  Adjusted R-squared:  0.1436
## F-statistic: 3.012 on 1 and 11 DF,  p-value: 0.1105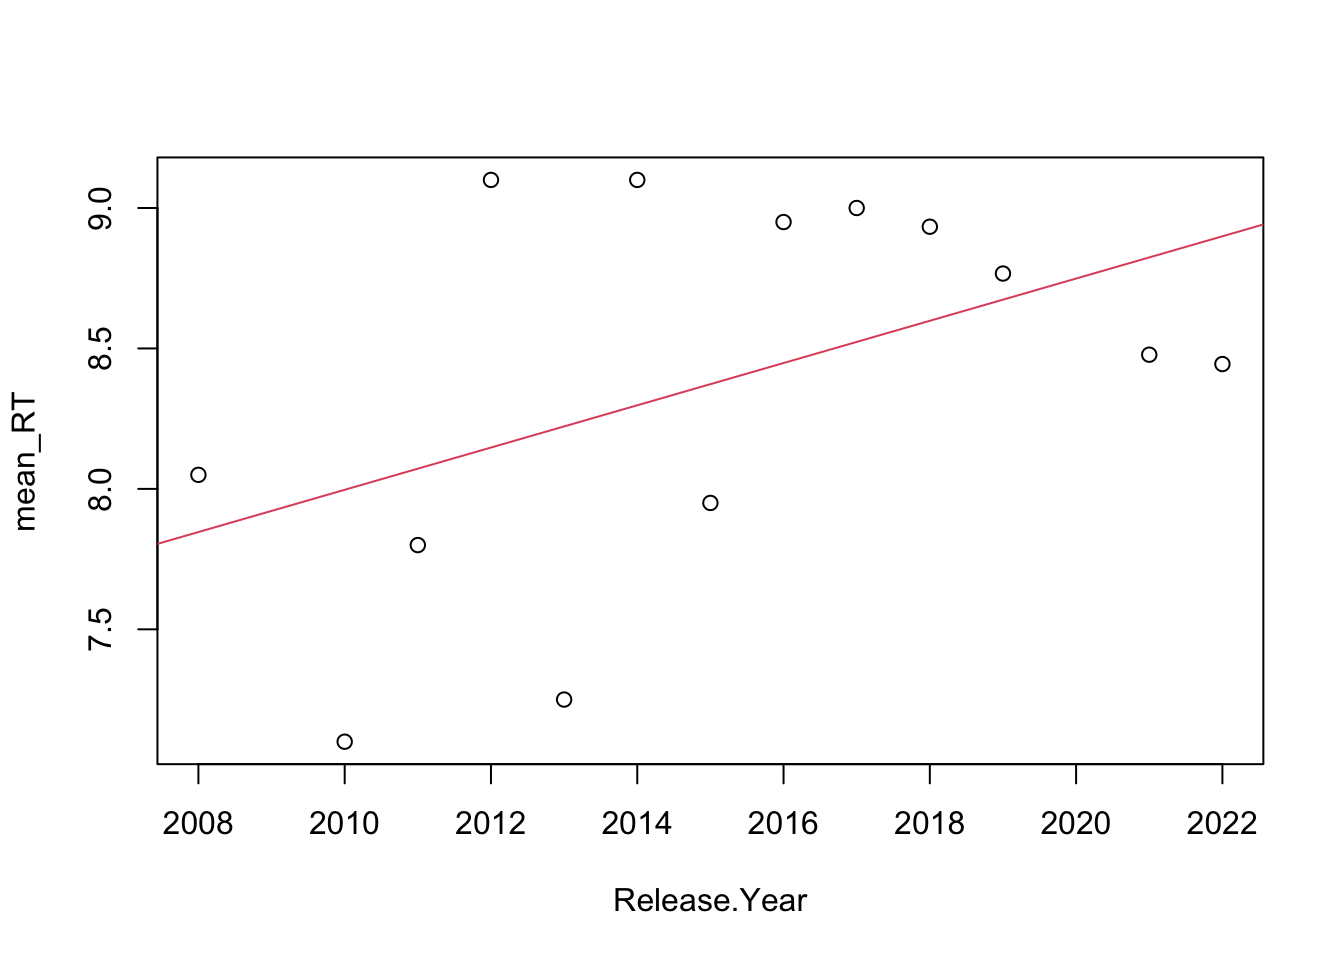
Figure 2.8: Trend line for the RT ratings.
##
## Call:
## lm(formula = mean_IMDb ~ Release.Year)
##
## Residuals:
##        1        2        3        4        5        6
## -0.13188 -0.01932  0.04324  0.13913  0.29758 -0.32874
##
## Coefficients:
##               Estimate Std. Error t value Pr(>|t|)
## (Intercept)  268.30362   94.58928   2.837   0.0470 *
## Release.Year  -0.12923    0.04685  -2.758   0.0509 .
## ---
## Signif. codes:  0 '***' 0.001 '**' 0.01 '*' 0.05 '.' 0.1 ' ' 1
##
## Residual standard error: 0.2427 on 4 degrees of freedom
## Multiple R-squared:  0.6554, Adjusted R-squared:  0.5692
## F-statistic: 7.607 on 1 and 4 DF,  p-value: 0.05095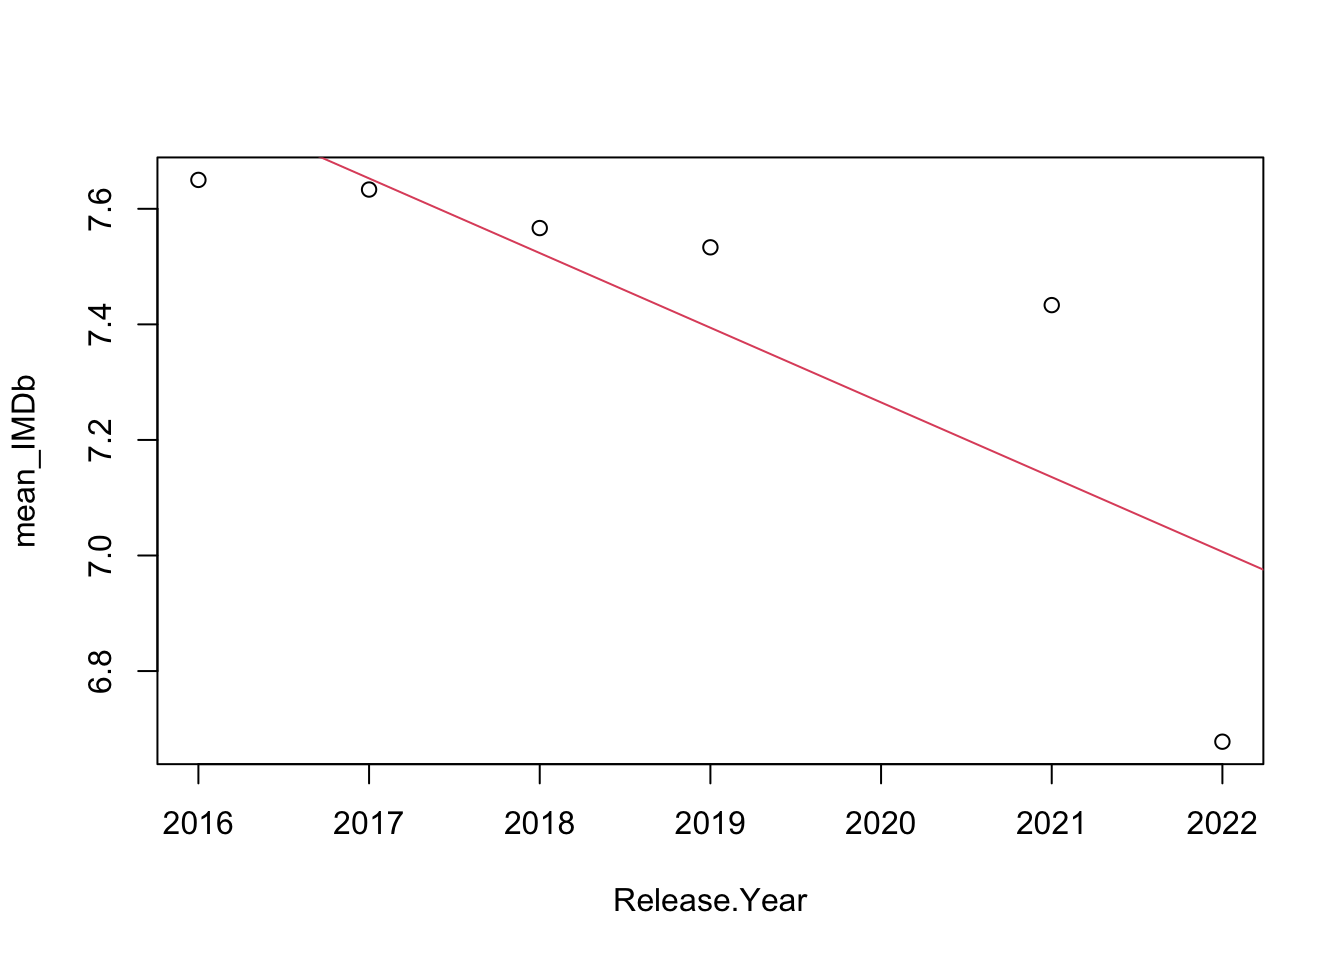
Figure 2.9: Trend line for the IMDb ratings, starting 2016.
##
## Call:
## lm(formula = mean_RT ~ Release.Year)
##
## Residuals:
##         1         2         3         4         5         6
## -0.100552  0.051277  0.086439  0.021601 -0.063630  0.004865
##
## Coefficients:
##               Estimate Std. Error t value Pr(>|t|)
## (Intercept)  214.33751   30.65688   6.991  0.00220 **
## Release.Year  -0.10183    0.01519  -6.706  0.00257 **
## ---
## Signif. codes:  0 '***' 0.001 '**' 0.01 '*' 0.05 '.' 0.1 ' ' 1
##
## Residual standard error: 0.07866 on 4 degrees of freedom
## Multiple R-squared:  0.9183, Adjusted R-squared:  0.8979
## F-statistic: 44.97 on 1 and 4 DF,  p-value: 0.002574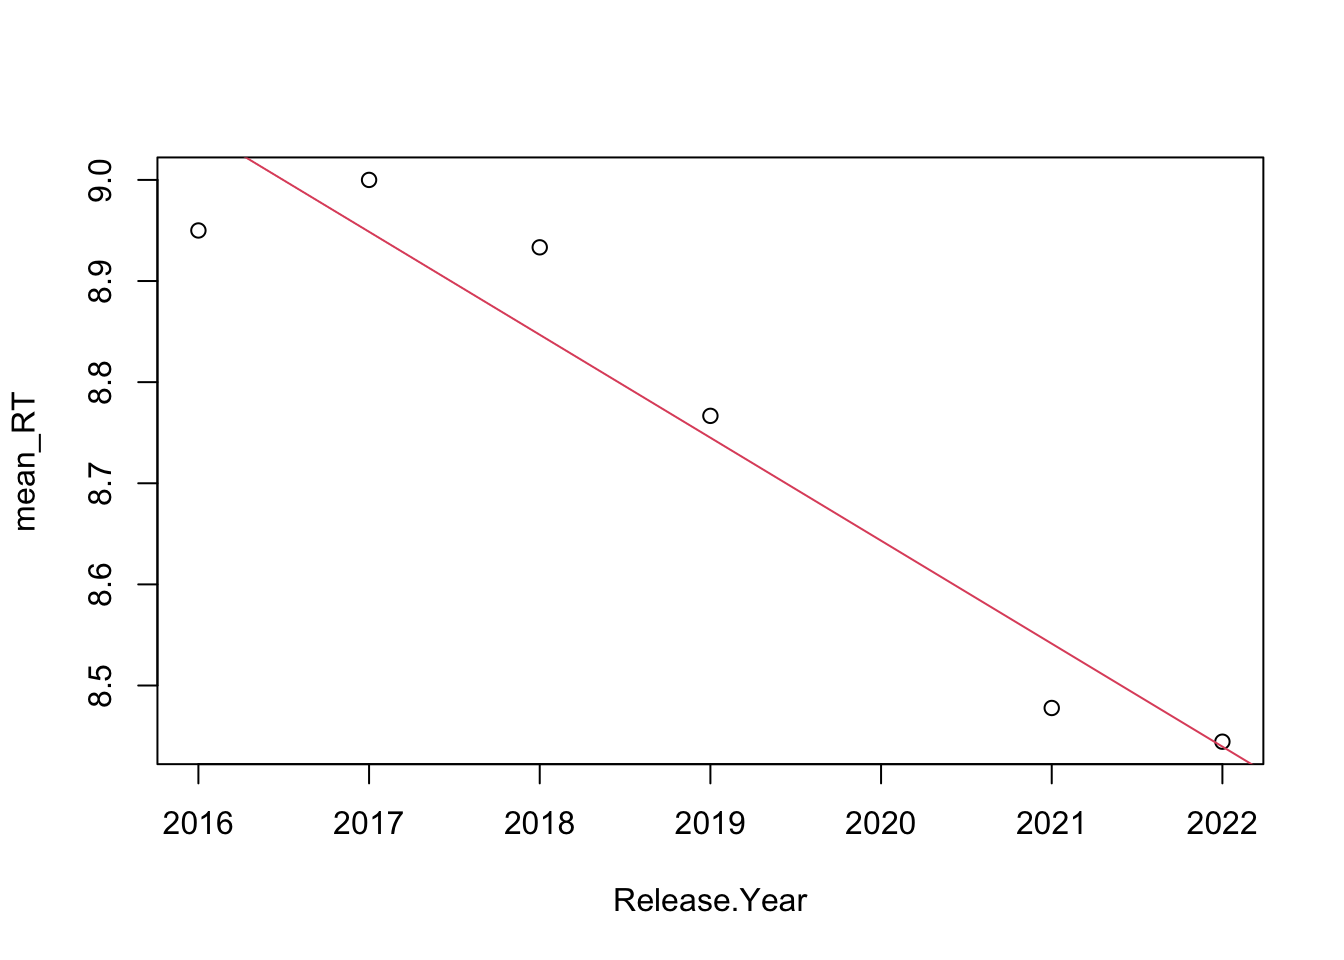
Figure 2.10: Trend line for the RT ratings, starting 2016.