Data Visualizatoin I(Quiz4)
library(gapminder)
library(tidyverse)
## -- Attaching packages --------------------------------------- tidyverse 1.3.1 --
## v ggplot2 3.3.5     v purrr   0.3.4
## v tibble  3.1.4     v dplyr   1.0.7
## v tidyr   1.1.3     v stringr 1.4.0
## v readr   2.0.1     v forcats 0.5.1
## -- Conflicts ------------------------------------------ tidyverse_conflicts() --
## x dplyr::filter() masks stats::filter()
## x dplyr::lag()    masks stats::lag()
gapminder %>%
  filter(year=="2007") %>%
  dplyr::select(-year) %>%
  arrange(desc(pop)) %>%
  mutate(country=factor(country,country)) %>%
ggplot(mapping=aes(x=gdpPercap, y=lifeExp,size=pop,fill=continent)) +
  geom_point(alpha=0.5,shape=21,color="black")+
  scale_size(range=c(.1,24),name="Population(M)") +
  theme_minimal() +
  theme(legend.position="right") +
  labs(
    subtitle="Life Expectancy vs. GDP per Capita",
    y="Life Expectancy",
    x="GDP per Capita",
    title="Scatter Plot",
    caption="Source:gapminder"
  )
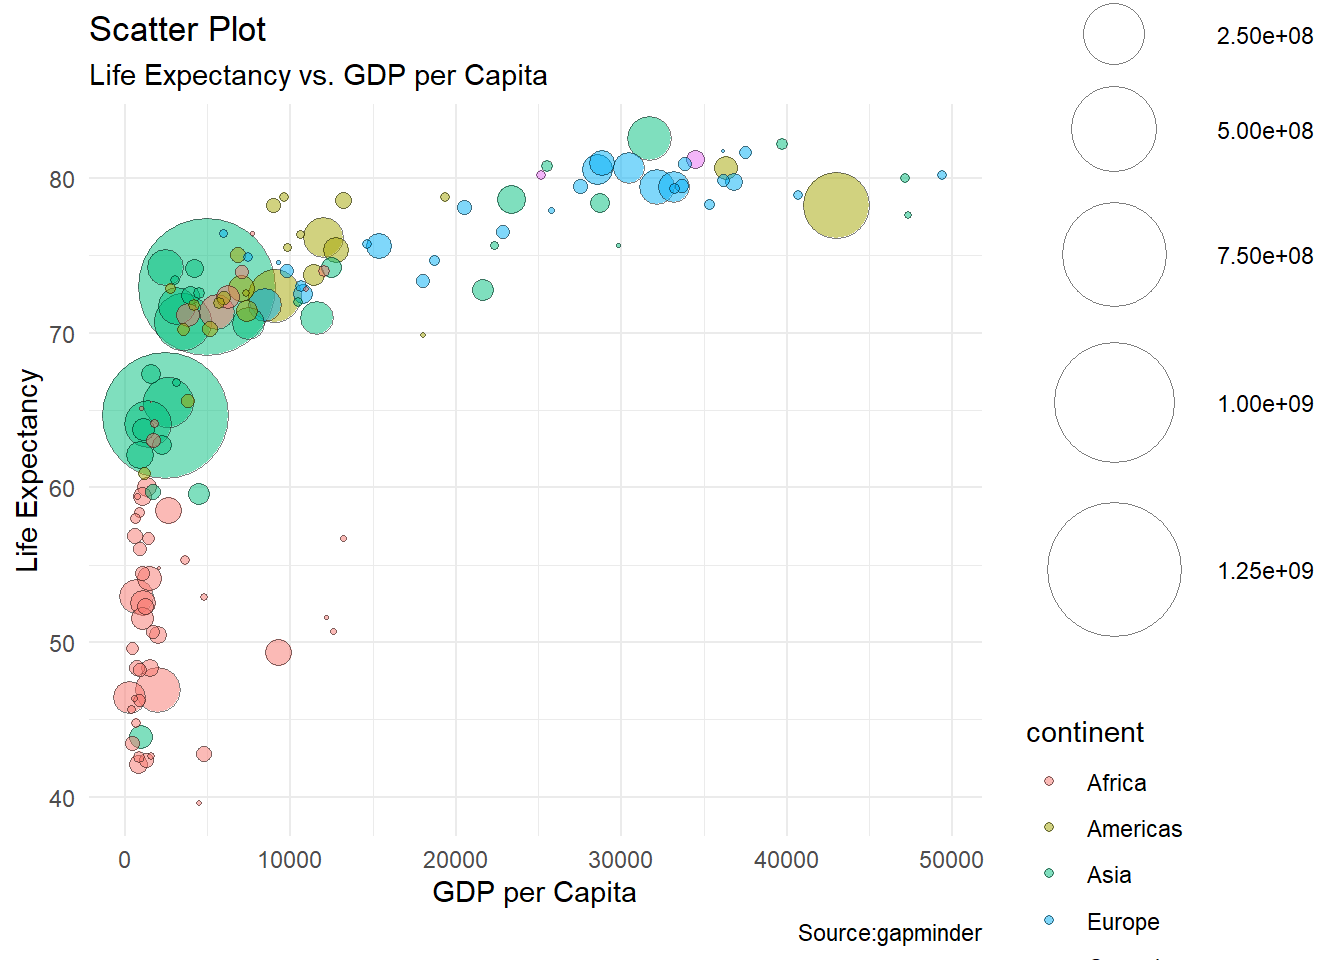
Quiz 4-1
gapminder %>%
  filter(year=="2007") %>%
  dplyr::select(-year) %>%
  arrange(desc(pop)) %>%
  mutate(country=factor(country,country)) %>%
ggplot(mapping=aes(lifeExp,size=pop,fill=continent))+geom_histogram()
## `stat_bin()` using `bins = 30`. Pick better value with `binwidth`.
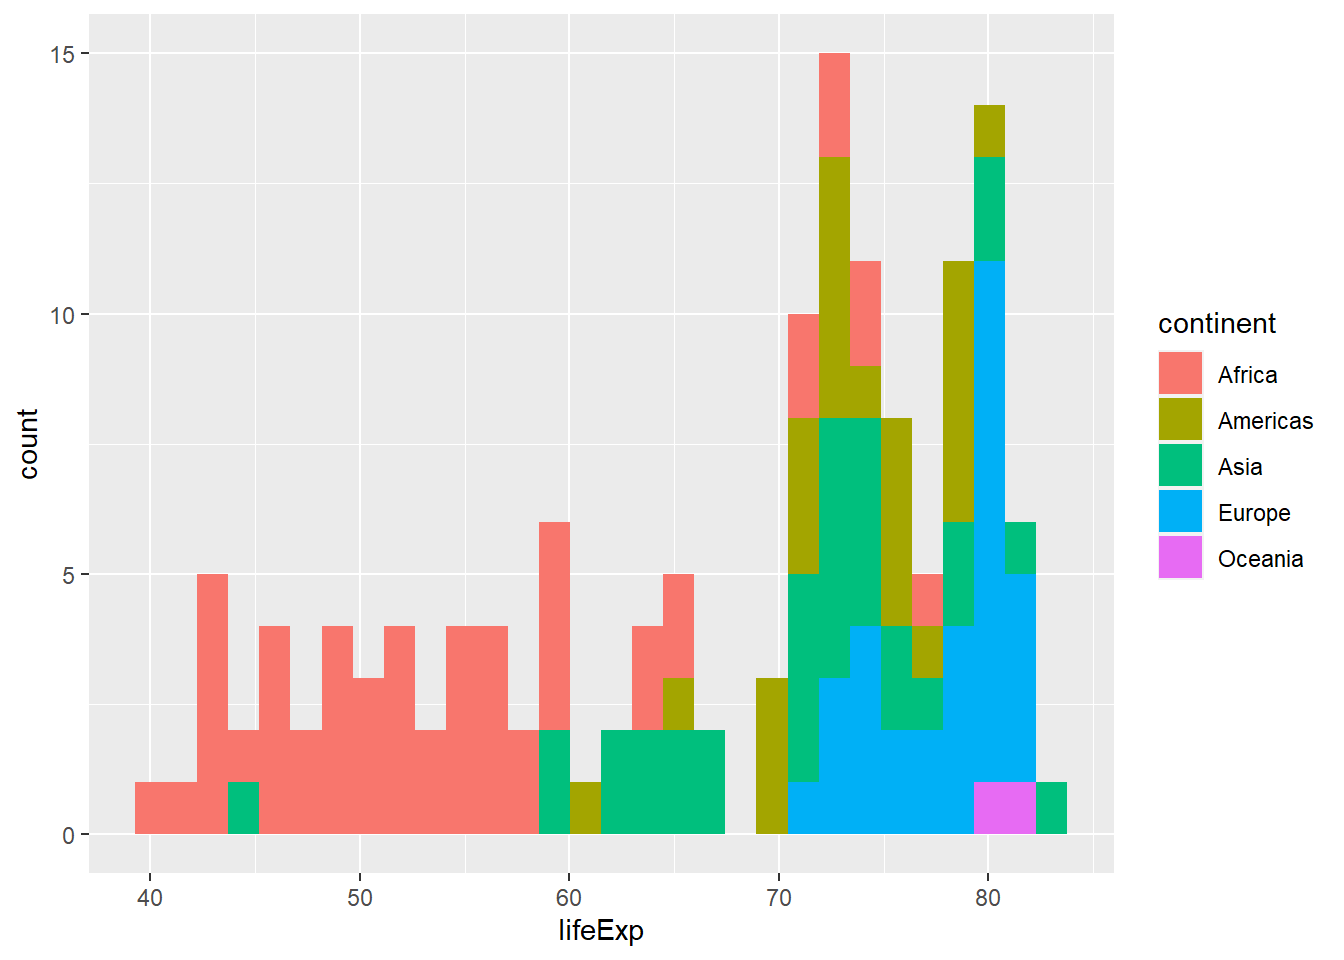
Quiz 4-2
gapminder %>%
  filter(year=="2007") %>%
  dplyr::select(-year) %>%
  arrange(desc(pop)) %>%
  mutate(country=factor(country,country)) %>%
ggplot(mapping=aes(lifeExp,size=pop,fill=continent))+geom_histogram()+ facet_wrap(vars(continent))
## `stat_bin()` using `bins = 30`. Pick better value with `binwidth`.
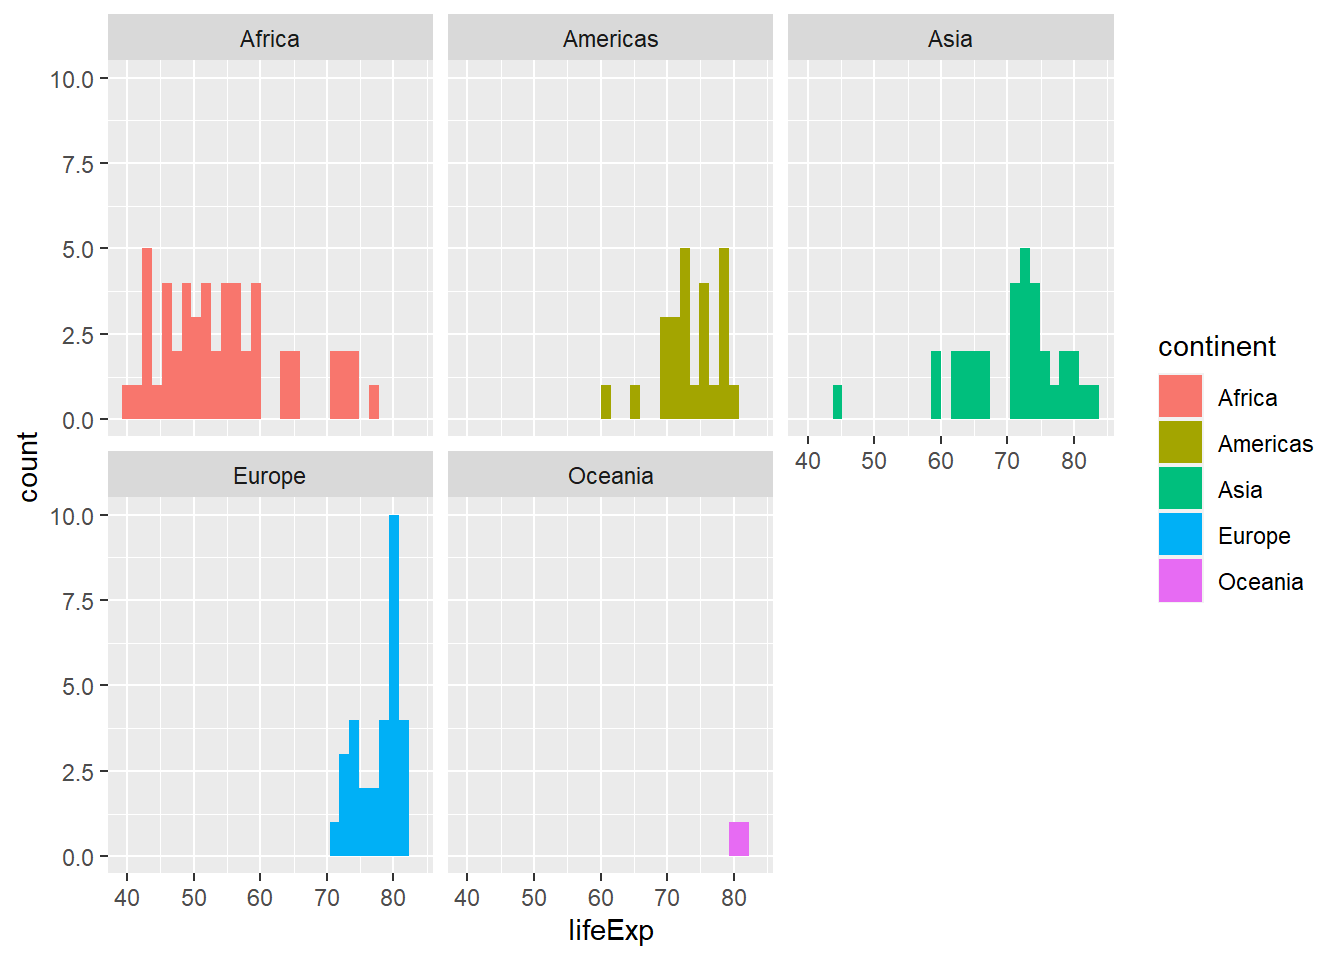
Quiz 4-3
gapminder %>%
  filter(year=="2007") %>%
  dplyr::select(-year) %>%
  arrange(desc(pop)) %>%
  mutate(country=factor(country,country)) %>%
  ggplot(mapping=aes(y=lifeExp,size=pop,fill=continent))+geom_boxplot()
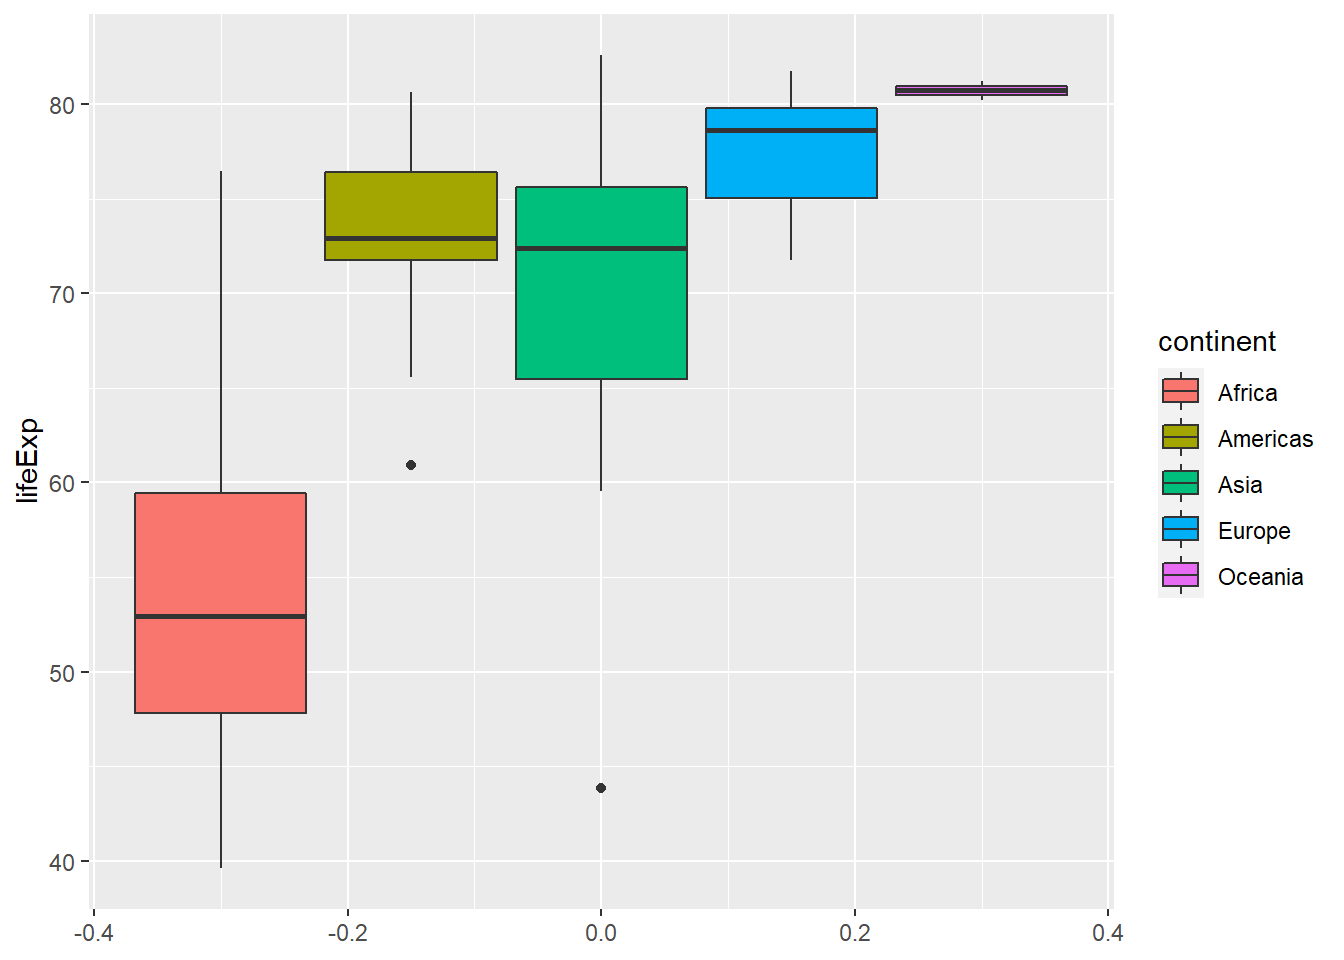
Quiz 4-4
gapminder %>%
  ggplot(mapping=aes(x=year, y=lifeExp,color=continent,group=country))+geom_line()
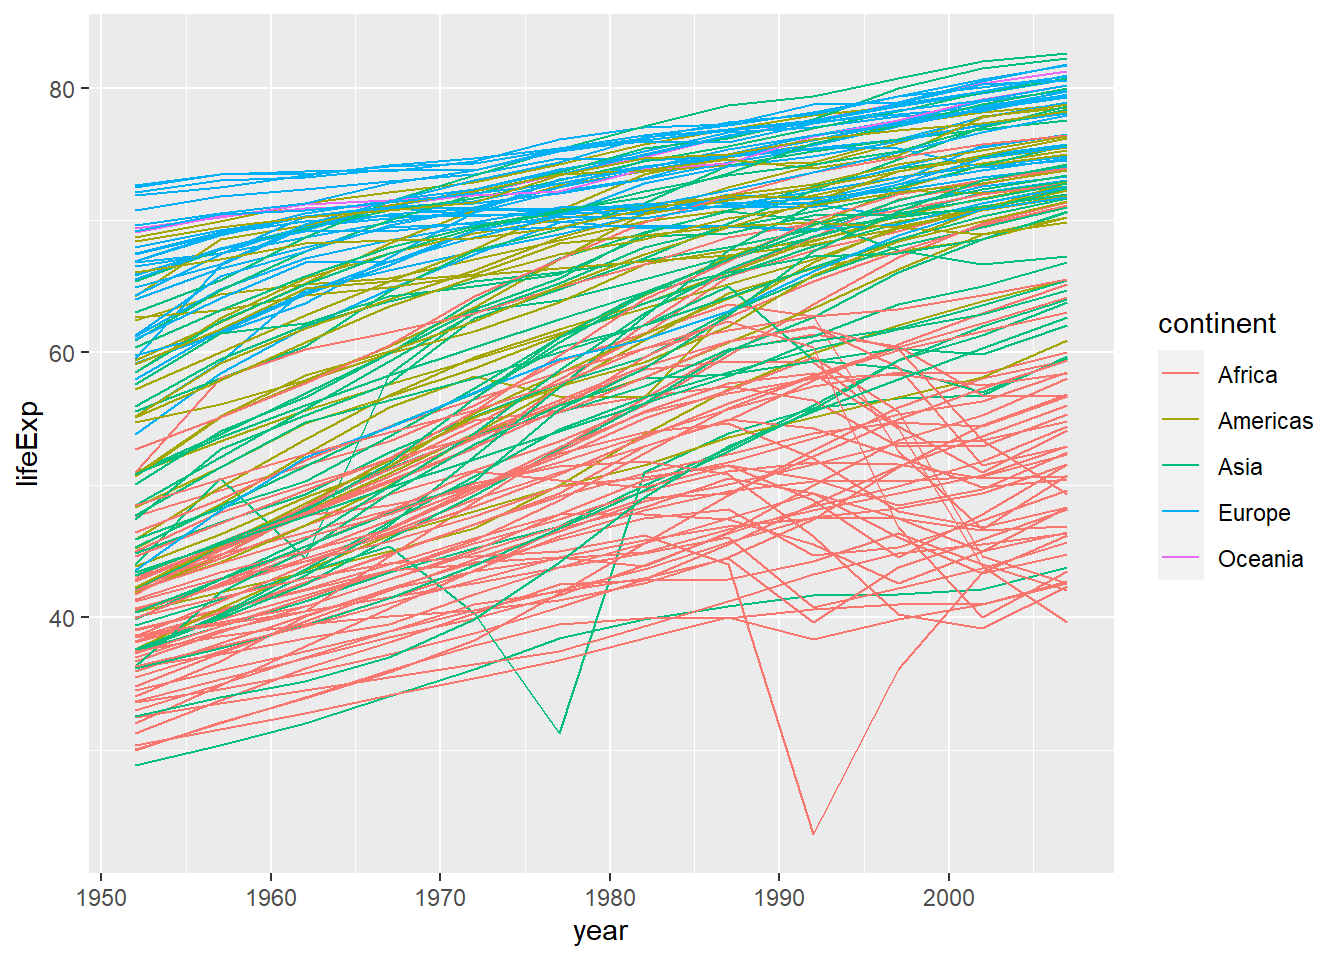
Quiz 4-5
gapminder %>%
  ggplot(mapping=aes(x=year, y=lifeExp,color=continent,group=country))+geom_line() +
  facet_wrap(vars(continent))
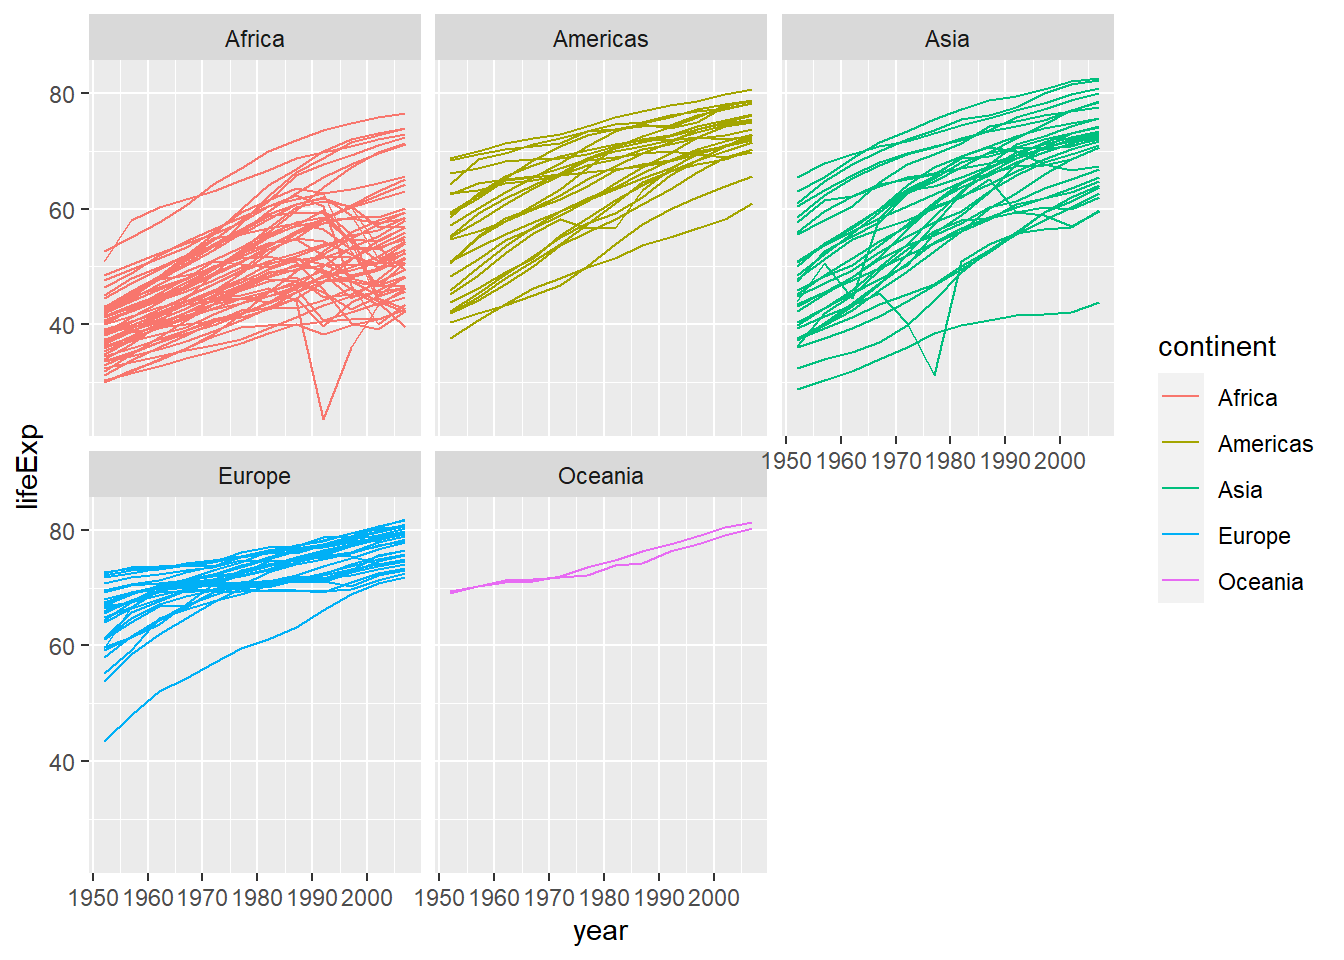
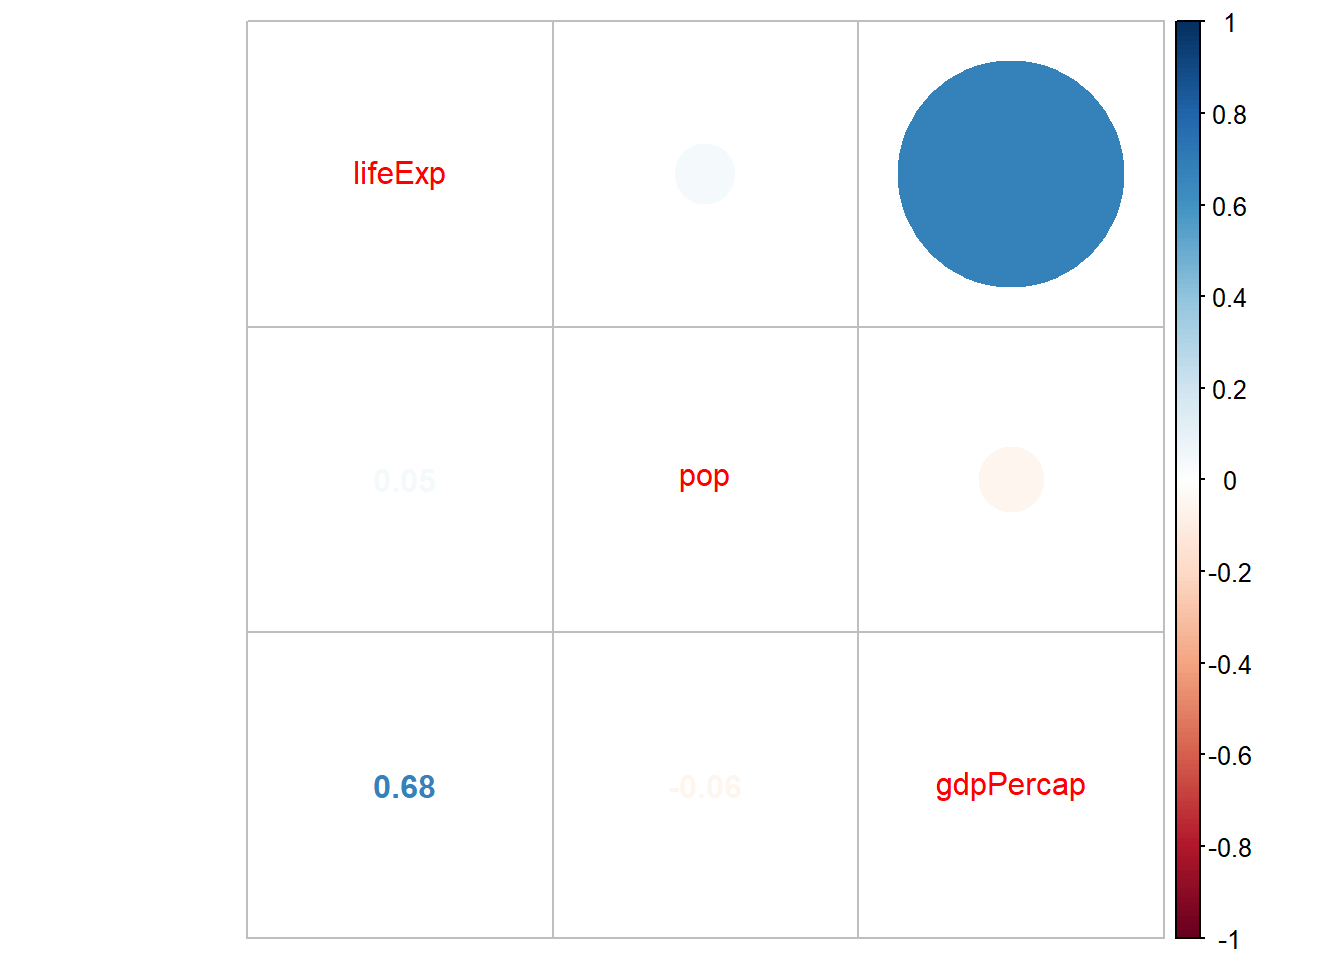
Quiz 4-6
## corrplot 0.90 loaded
gapminder %>%
  filter(year=="2007") %>%
  select(lifeExp, pop, gdpPercap) %>%
  cor() %>%
  corrplot.mixed()