References
6.1 R Markdown
This is an R Markdown document. Markdown is a simple formatting syntax for authoring HTML, PDF, and MS Word documents. For more details on using R Markdown see http://rmarkdown.rstudio.com.
When you click the Knit button a document will be generated that includes both content as well as the output of any embedded R code chunks within the document. You can embed an R code chunk like this:
summary(cars)## speed dist
## Min. : 4.0 Min. : 2.00
## 1st Qu.:12.0 1st Qu.: 26.00
## Median :15.0 Median : 36.00
## Mean :15.4 Mean : 42.98
## 3rd Qu.:19.0 3rd Qu.: 56.00
## Max. :25.0 Max. :120.006.2 Including Plots
You can also embed plots, for example:
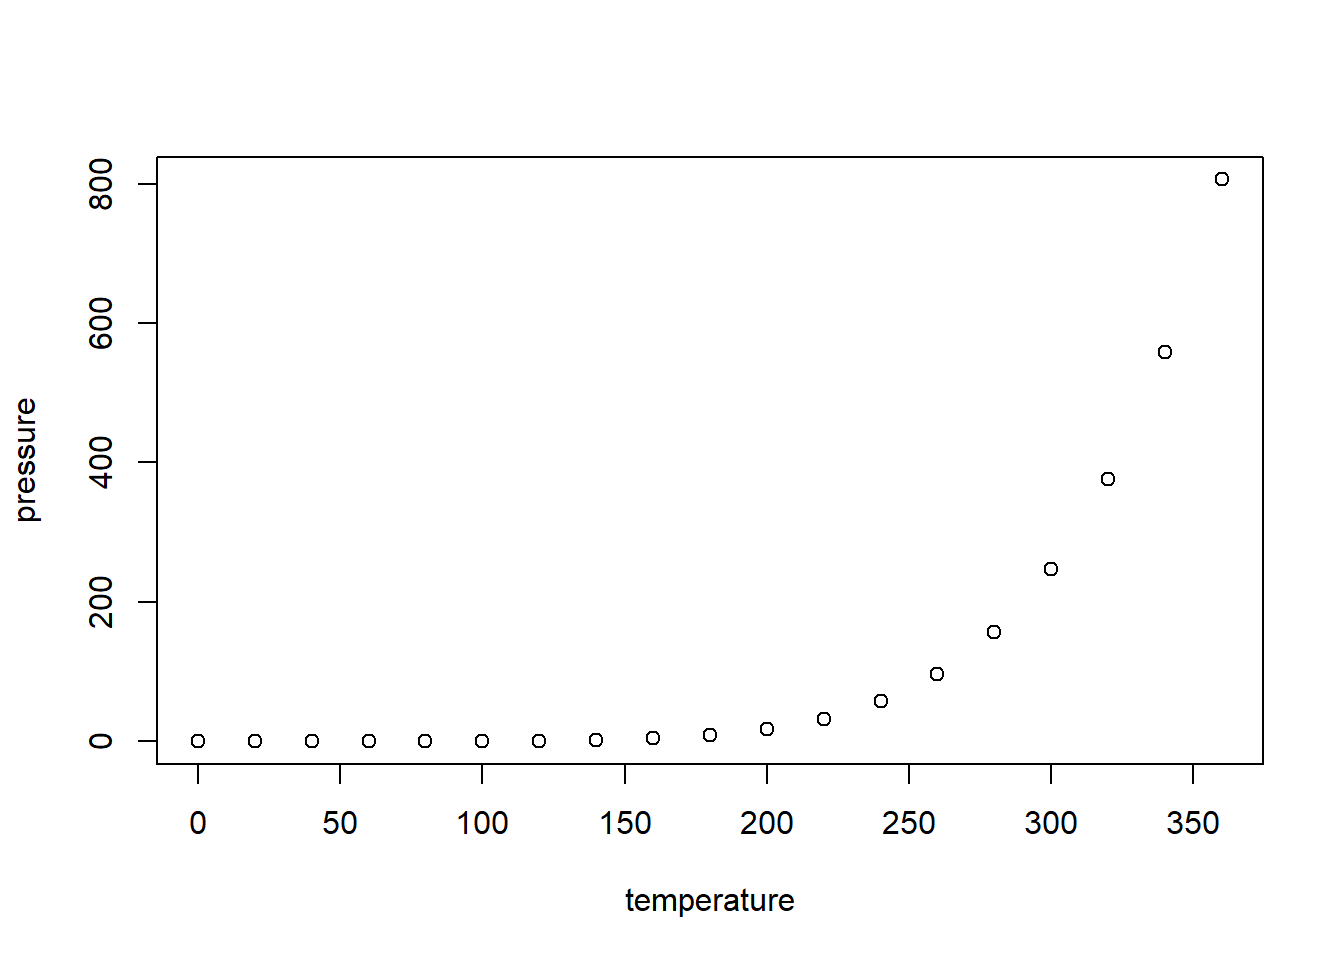
Note that the echo = FALSE parameter was added to the code chunk to prevent printing of the R code that generated the plot.
head(iris)
library(tidyverse) iris %>% pivot_longer(cols = -Species, names_to = “Part,” values_to = “Value”) %>% separate(col = “Part,” into = c(“Part,” “Measure”))
iris %>% pivot_longer(cols = -Species, names_to = “Part,” values_to = “Value”) %>% separate(col = “Part,” into = c(“Part,” “Measure”)) %>% group_by(Species, Part) %>% summarize(m = mean(Value))
iris %>% pivot_longer(cols = -Species, names_to = “Part,” values_to = “Value”) %>% separate(col = “Part,” into = c(“Part,” “Measure”)) %>% ggplot(aes(x = Value, color = Part)) + geom_boxplot()