Chapter 1 I/O
In this Chapter, we will introduce basic functions to read text, excel and JSON files as well as large files.
We will also show how to obtain free financial and economic data including the following:
- End-of-day and real-time pricing;
- Company financials;
- Macroeconomic data.
Data sources utilized in this Chapter include the following:
- U.S. Securities and Exchange Commission;
- Quandl;
- IEX;
- Alpha Vantage.
1.1 Importing Data
1.1.1 Text Files
The most basic and commonly used option to import data from text files in R is the use of the function read.table from the r-base. We can use this function to read text files with extensions such as .txt and .csv.
dat.table <- read.table(file = "<name of your file>.txt")
dat.csv <- read.csv(file = "<name of your file>.csv")
The package readr provides functions for reading text data into R that are much faster that the functions from the r-base. The read_table function from the package readr provides a near-replacement for the read.table function.
library(readr)
dat.table <- readr::read_table2(file = "<name of your file>.txt")
dat.csv <- readr::read_csv(file = "<name of your file>.csv")
Another option to save data is to write it in rds format. Data stored in rds format has the advantage to keep the original data struture and type of the object saved. Also, .rds files are compressed and consume less space than files saved in .csv format. A data.frame object can be saved in rds format and then loaded back as follows:
write_rds(dat.frame, path = "<name of your file>.rds")
dat.frame <- read_rds(path = "<name of your file>.rds")
1.1.2 Excel Files
The package readxl has an ease to use interface to functions that load excel documents in R. The functions read_xls and read_xlsx can be used to read excel files as follows:
library(readxl)
readxl::read_xls(path = "<name of your file>.xls")
readxl::read_xlsx(path = "<name of your file>.xlsx")
The function read_excel() automatically detects the extension of the input file as follows:
readxl::read_excel("<name and extension of your file>", sheet = "<sheet name or index>")In the read_excel function, the sheet argument can receive either the target sheet name or index number, where sheet indexing starts at 1.
The readxl has been oberving increased use compared to other comparable packages such as gdata and the xlsx due to its relative ease of use and performance. Also, the readxl do not have depency with external code libraries while the packages gdata and xlsx depend on ActiveState PERL and the Java JDK, respectively.
1.1.3 JSON Files
JSON files are particularly used for transmitting data in web applications but also frequently used as a standard data interchange format.
The jsonline package can be used to parse files in JSON format as follows:
library(jsonlite)
result_json <- read_json("<json file>")
1.1.4 Large Files
Fast data manipulation in a short and flexible syntax.
1.2 Data Sources
In this section, we will show how to obtain financial and economic data from public sources.
1.2.1 Alpha Vantage
Alpha Vantage offers free access to pricing data including:
- Stock Time Series Data;
- Physical and Digital/Crypto Currencies (e.g., Bitcoin);
- Technical Indicators and
- Sector Performances.
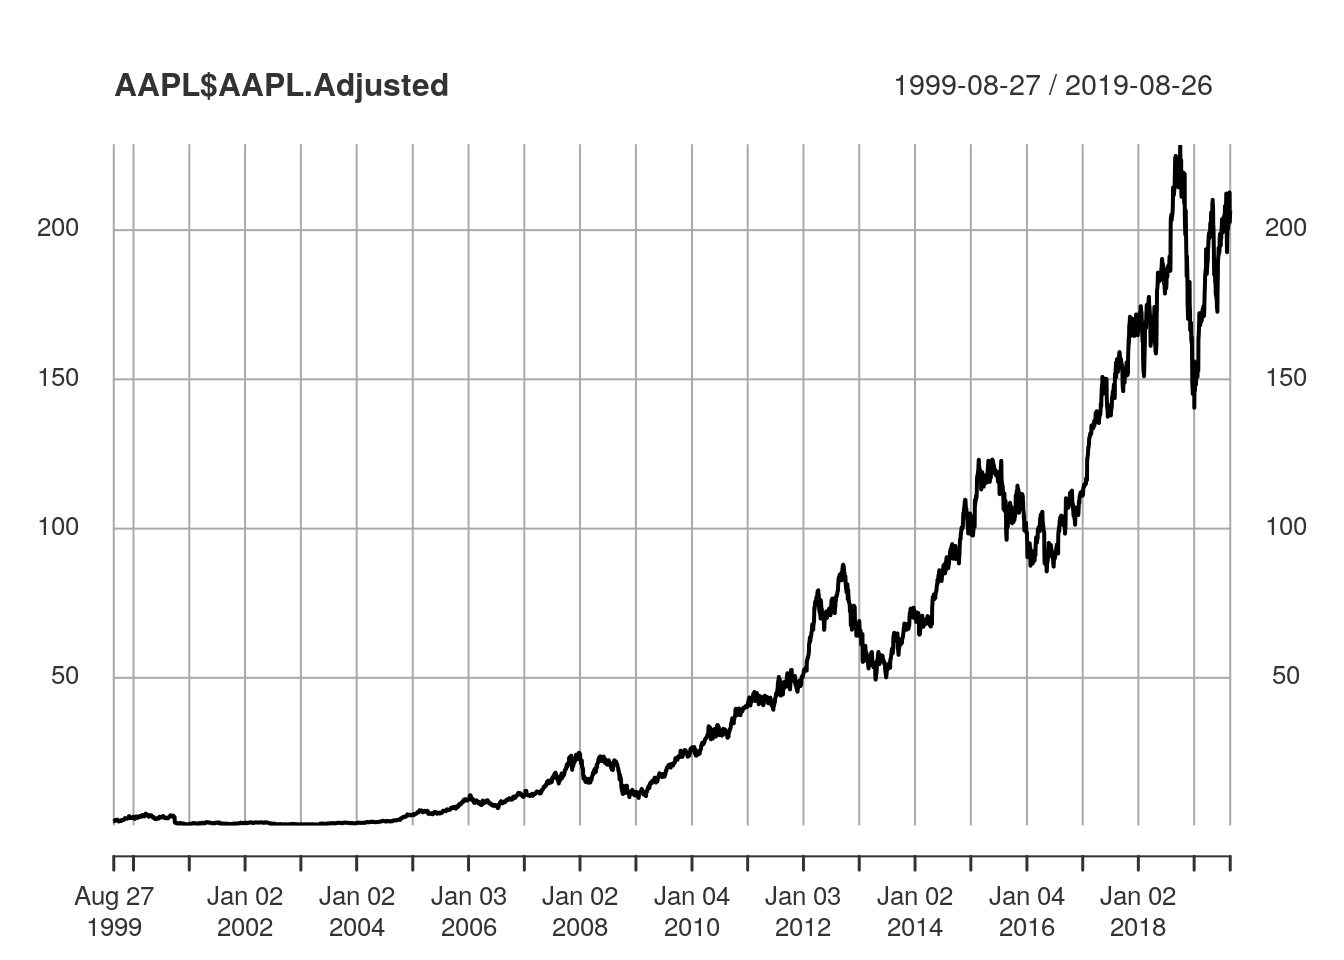
The data are available in JSON and CSV formats via REST APIs. The quantmod and the alphavantager R packages offer a lightweight R interface to the Alpha Vantage API. Daily stock prices can be obtained with the quantmod::getSymbols function as follows:
getSymbols(Symbols='AAPL', src="av", output.size="full", adjusted=TRUE, api.key='your API key')The output data is stored in an object with the same name as the corresponding symbol, in this example AAPL. The output data looks like the following
| AAPL.Open | AAPL.High | AAPL.Low | AAPL.Close | AAPL.Volume | AAPL.Adjusted |
|---|---|---|---|---|---|
| 62.8 | 65.0 | 62.7 | 64.8 | 1.12e+08 | 2.02 |
| 65.0 | 65.0 | 62.0 | 62.1 | 8.41e+07 | 1.93 |
| 62.6 | 65.9 | 62.1 | 65.2 | 1.59e+08 | 2.03 |
| 67.0 | 68.8 | 66.0 | 68.6 | 1.97e+08 | 2.14 |
| 67.6 | 71.4 | 66.9 | 70.6 | 2.24e+08 | 2.20 |
| 71.9 | 75.2 | 70.5 | 73.5 | 4.09e+08 | 2.29 |
We called the quantmod::getSymbols function with the following arguments:
Symbols='AAPL'defines a character vector specifying the names of each symbol to be loaded, here specified by the symbol of the company Apple Inc.;src="av"specifies the sourcing method, here defined with the value corresponding to Alpha Vantage;output.size="full"specified length of the time series returned. The stringscompactandfullare accepted with the following specifications:compactreturns only the latest 100 data points;fullreturns the full-length time series of up to 20 years of historical data;adjusted=TRUEdefines a boolean variable to include a column of closing prices adjusted for dividends and splits;api.keyspecifies your Alpha Vantage API key.
1.2.2 IEX
The IEX Group operates the Investors Exchange (IEX), a stock exchange for U.S. equities that is built for investors and companies. IEX offers U.S. reference and market data including end-of-day and intraday pricing data. IEX offers an API with “a set of services designed for developers and engineers. It can be used to build high-quality apps and services”. Data sourced from the IEX API is freely available for commercial subject to conditions and the use of their API is subject to additional terms of use.
IEX lists the following github project as an unofficial API for R: https://github.com/imanuelcostigan/iex. We will provide examples on how to obtain intraday pricing data using this package. First, we will use the devtools to install the package directly from its github repository as follows:
library(devtools)
install_github("imanuelcostigan/iex")
The iex package provides 4 set of functions as follows:
last: Provides IEX near real time last sale price, size and time. Last is ideal for developers that need a lightweight stock quote. IEX API real time API documentation.market: Provides exchange trade volume data in near real time. IEX market API documentation.stats: A set of functions that return trading statistics. IEX stats API documentation.tops: Provides IEX’s aggregated bid and offer position in near real time for all securities on IEX’s displayed limit order book. IEX API TOPS documentation.
For instance, the last function has the following arguments:
symbols: A vector of tickers (case insensitive). Special characters will be escaped. A list of eligible symbols is published daily by the IEX. When set toNULL(default) returns values for all symbols.fields: A vector of fields names to return (case sensitive). When set toNULL(default) returns values for all fields.version: The API version number, which is used to define the API URL.
We can obtain intraday stock price data with the last function as follows:
dat <- iex::last(symbols = c("AAPL"), fields = c("symbol", "price", "size")) The function returns an S3 object of class iex_api which has three accessible fields: path , response and content.
- The
pathcontains the corresponding IEX API path:
dat$path## [1] "tops/last"- The
responsecontains the unparsed IEX API response:
dat$response## Response [https://api.iextrading.com/1.0/tops/last?symbols=AAPL&filter=symbol%2Cprice%2Csize]
## Date: 2019-08-27 02:04
## Status: 200
## Content-Type: application/json; charset=utf-8
## Size: 45 B- The
contentcontains the parsed content from the API’s response:
dat$content## [[1]]
## [[1]]$symbol
## [1] "AAPL"
##
## [[1]]$price
## [1] 207
##
## [[1]]$size
## [1] 100According to the developer, this package causes R to pause 0.2 seconds after executing an API call to avoid the user being throttled by the IEX API (which enforces a 5 request per second limit). Documentation about the other set of functions can be obtained at https://github.com/imanuelcostigan/iex/tree/master/man.
1.2.3 Quandl
Quandl is likely the largest financial and alternative data aggregator/provider today. They leverage relationships with third-party providers to be a one-stop-shop for alternative data and traditional fundamental, pricing and estimates datasets.
Quandl offer an API which usage is free for registered users. You can obtain an API key here. After signing up, just append your API key to your call like this:
https://www.quandl.com/api/v3/datasets/WIKI/FB/data.csv?api_key=YOURAPIKEYHEREAt Quandl, every dataset is identified by “Quandl code”, which is a unique id. In the above example, you downloaded a dataset with the Quandl code “WIKI/FB”.
Every Quandl code has 2 parts: the database code (“WIKI”) which specifies where the data comes from, and the dataset code (“FB”) which identifies the specific time series you want.
You can find Quandl codes using their data browser. Additional API documentation can be found here.
Quandl is also available via an R interface (Raymond McTaggart, Gergely Daroczi, and Clement Leung 2019). For instance, we can obtain Crude Oil Futures prices from 01/01/2010 to 01/01/2019 as follows:
library(Quandl)
Quandl.api_key(config::get()$quandl.key)
from.dat <- as.Date("01/01/2010", format="%d/%m/%Y")
to.dat <- as.Date("01/01/2019", format="%d/%m/%Y")
crude.oil.futures<-Quandl("CHRIS/CME_CL1", start_date = from.dat, end_date = to.dat, type="xts")
plot(crude.oil.futures$Last)
In the example above we specified the following Database/Dataset:
- Database: “CHRIS”. Continuous contracts for all 600 futures on Quandl. Built on top of raw data from CME, ICE, LIFFE etc. Curated by the Quandl community. 50 years history.
- Dataset: “CME_CL1”. Historical futures prices of Crude Oil Futures, Continuous Contract #1. Non-adjusted price based on spot-month continuous contract calculations. Raw data from CME.
1.2.4 SEC
Official filings are freely available from the U.S. Securities and Exchange Commission’s EDGAR database. The package finreportr provides an interface in R to facilitate financial analysis from SEC’s 10K and 10K/A filings.
We can obtain company basic information with the function the CompanyInfo function by passing the ticker symbol of the target company as follows:
library("finreportr")
AAPL.Info<-CompanyInfo("AAPL")
print(AAPL.Info)
## company CIK SIC state state.inc FY.end street.address
## 1 Apple Inc. 0000320193 3571 CA CA 0930 ONE APPLE PARK WAY
## city.state
## 1 CUPERTINO CA 95014As a result, we obtain the following information:
- Company name: Apple Inc.;
- SEC Central Index Key (CIK): 0000320193;
- Standard Industrial Classification (SIC): 3571, which is the industry code for Electronic Computers;
- Address: ONE APPLE PARK WAY, CUPERTINO CA 95014;
- Most recent period of report end is 0930.
The list of company annual reports with corresponding filing dates can be obtained with the function AnnualReports as follows:
AAPL.reports<-AnnualReports("AAPL")| filing.name | filing.date | accession.no |
|---|---|---|
| 10-K | 2018-11-05 | 0000320193-18-000145 |
| 10-K | 2017-11-03 | 0000320193-17-000070 |
| 10-K | 2016-10-26 | 0001628280-16-020309 |
| 10-K | 2015-10-28 | 0001193125-15-356351 |
| 10-K | 2014-10-27 | 0001193125-14-383437 |
| 10-K | 2013-10-30 | 0001193125-13-416534 |
The accession number is a unique identifier that the SEC creates for each filing.
Company financials are organized into 3 segments: Income Statement, Balance Sheet and Cash Flow.
Income Statement
Financials from the Income Statement segment can be obtained with the GetIncome function as follows:
AAPL.IS<-GetIncome("AAPL", 2017)| Metric | Units | Amount | startDate | endDate |
|---|---|---|---|---|
| Revenue, Net | usd | 233715000000 | 2014-09-28 | 2015-09-26 |
| Revenue, Net | usd | 75872000000 | 2015-09-27 | 2015-12-26 |
| Revenue, Net | usd | 50557000000 | 2015-12-27 | 2016-03-26 |
| Revenue, Net | usd | 42358000000 | 2016-03-27 | 2016-06-25 |
| Revenue, Net | usd | 46852000000 | 2016-06-26 | 2016-09-24 |
| Revenue, Net | usd | 215639000000 | 2015-09-27 | 2016-09-24 |
The Income Statement function returns data for the following metrics:
| Metrics |
|---|
| Revenue, Net |
| Cost of Goods and Services Sold |
| Gross Profit |
| Research and Development Expense |
| Selling, General and Administrative Expense |
| Operating Expenses |
| Operating Income (Loss) |
| Nonoperating Income (Expense) |
| Income (Loss) from Continuing Operations before Income Taxes, Noncontrolling Interest |
| Income Tax Expense (Benefit) |
| Net Income (Loss) Attributable to Parent |
| Earnings Per Share, Basic |
| Earnings Per Share, Diluted |
| Weighted Average Number of Shares Outstanding, Basic |
| Weighted Average Number of Shares Outstanding, Diluted |
| Common Stock, Dividends, Per Share, Declared |
Balance Sheet
Financials from the Balance Sheet segment can be obtained with the GetBalanceSheet function as follows:
AAPL.BS<-GetBalanceSheet("AAPL", 2017)| Metric | Units | Amount | startDate | endDate |
|---|---|---|---|---|
| Cash and Cash Equivalents, at Carrying Value | usd | 13844000000 | NA | 2014-09-27 |
| Cash and Cash Equivalents, at Carrying Value | usd | 21120000000 | NA | 2015-09-26 |
| Cash and Cash Equivalents, at Carrying Value | usd | 20484000000 | NA | 2016-09-24 |
| Cash and Cash Equivalents, at Carrying Value | usd | 20289000000 | NA | 2017-09-30 |
| Available-for-sale Securities, Current | usd | 46671000000 | NA | 2016-09-24 |
| Available-for-sale Securities, Current | usd | 53892000000 | NA | 2017-09-30 |
The Balance Sheet function returns data for the following metrics:
| Metrics |
|---|
| Cash and Cash Equivalents, at Carrying Value |
| Available-for-sale Securities, Current |
| Accounts Receivable, Net, Current |
| Inventory, Net |
| Nontrade Receivables, Current |
| Other Assets, Current |
| Assets, Current |
| Available-for-sale Securities, Noncurrent |
| Property, Plant and Equipment, Net |
| Goodwill |
| Intangible Assets, Net (Excluding Goodwill) |
| Other Assets, Noncurrent |
| Assets |
| Accounts Payable, Current |
| Accrued Liabilities, Current |
| Deferred Revenue, Current |
| Commercial Paper |
| Long-term Debt, Current Maturities |
| Liabilities, Current |
| Deferred Revenue, Noncurrent |
| Long-term Debt, Excluding Current Maturities |
| Other Liabilities, Noncurrent |
| Liabilities |
| Commitments and Contingencies |
| Common Stocks, Including Additional Paid in Capital |
| Retained Earnings (Accumulated Deficit) |
| Accumulated Other Comprehensive Income (Loss), Net of Tax |
| Stockholders’ Equity Attributable to Parent |
| Liabilities and Equity |
Cash Flow
Financials from the Cash Flow segment can be obtained with the GetCashFlow function as follows:
AAPL.CF<-GetCashFlow("AAPL", 2017)| Metric | Units | Amount | startDate | endDate |
|---|---|---|---|---|
| Cash and Cash Equivalents, at Carrying Value | usd | 13844000000 | NA | 2014-09-27 |
| Cash and Cash Equivalents, at Carrying Value | usd | 21120000000 | NA | 2015-09-26 |
| Cash and Cash Equivalents, at Carrying Value | usd | 20484000000 | NA | 2016-09-24 |
| Cash and Cash Equivalents, at Carrying Value | usd | 20289000000 | NA | 2017-09-30 |
| Net Income (Loss) Attributable to Parent | usd | 53394000000 | 2014-09-28 | 2015-09-26 |
| Net Income (Loss) Attributable to Parent | usd | 18361000000 | 2015-09-27 | 2015-12-26 |
The Cash Flow function returns data for the following metrics:
| Metrics |
|---|
| Cash and Cash Equivalents, at Carrying Value |
| Net Income (Loss) Attributable to Parent |
| Depreciation, Amortization and Accretion, Net |
| Share-based Compensation |
| Deferred Income Tax Expense (Benefit) |
| Other Noncash Income (Expense) |
| Increase (Decrease) in Accounts Receivable |
| Increase (Decrease) in Inventories |
| Increase (Decrease) in Other Receivables |
| Increase (Decrease) in Other Operating Assets |
| Increase (Decrease) in Accounts Payable |
| Increase (Decrease) in Deferred Revenue |
| Increase (Decrease) in Other Operating Liabilities |
| Net Cash Provided by (Used in) Operating Activities |
| Payments to Acquire Available-for-sale Securities |
| Proceeds from Maturities, Prepayments and Calls of Available-for-sale Securities |
| Proceeds from Sale of Available-for-sale Securities |
| Payments to Acquire Businesses, Net of Cash Acquired |
| Payments to Acquire Property, Plant, and Equipment |
| Payments to Acquire Intangible Assets |
| Payments to Acquire Other Investments |
| Payments for (Proceeds from) Other Investing Activities |
| Net Cash Provided by (Used in) Investing Activities |
| Proceeds from Issuance of Common Stock |
| Excess Tax Benefit from Share-based Compensation, Financing Activities |
| Payments Related to Tax Withholding for Share-based Compensation |
| Payments of Dividends |
| Payments for Repurchase of Common Stock |
| Proceeds from Issuance of Long-term Debt |
| Repayments of Long-term Debt |
| Proceeds from (Repayments of) Commercial Paper |
| Net Cash Provided by (Used in) Financing Activities |
| Cash and Cash Equivalents, Period Increase (Decrease) |
| Income Taxes Paid, Net |
| Interest Paid |
1.3 Conclusion
- We showed how to load and import data from both local files and external sources.
- We provided examples on how to read tabular data and how to handle large files.
- We showed how to obtain financial and economic data from freely available sources.
1.3.1 Further Reading
To further learn how to use R to load, transform, visualize and model data see (Wickham and Grolemund 2017). Additional relevant R packages include the following:
- dplyr: Fast data frames manipulation and database query.
- reshape2: Flexibly rearrange, reshape and aggregate data.
- readr: A fast and friendly way to read tabular data into R.
- tidyr: Easily tidy data with spread and gather functions.
- rlist: A toolbox for non-tabular data manipulation with lists.
- jsonlite: A robust and quick way to parse JSON files in R.
- ff: Data structures designed to store large datasets.
- lubridate: A set of functions to work with dates and times.
References
Raymond McTaggart, Gergely Daroczi, and Clement Leung. 2019. Quandl: API Wrapper for Quandl.com. https://CRAN.R-project.org/package=Quandl.
Wickham, Hadley, and Garrett Grolemund. 2017. R for Data Science: Import, Tidy, Transform, Visualize, and Model Data. 1st ed. O’Reilly Media, Inc.