Chapter 14 DEG GO Enrichment
library(Seurat)
library(tidyverse)
library(magrittr)
library(ReactomePA)
library(clusterProfiler)
library(enrichplot)
library(org.Mmu.eg.db)
library(DOSE)
14.1 Load DEG
mk <- readRDS('data/Demo_CombinedSeurat_SCT_Preprocess_FilterLQCells_DEGPerCluster_Minpct03Mindiffpct02.rds')14.2 Get gene names per cluster
deg.ls <- split(rownames(mk), f = mk$cluster)14.3 Transfer gene symbol into entrez id
geneid.ls <- deg.ls %>% map(~{

  # here for macaque
  gene.df <- select(org.Mmu.eg.db,
                    keys = .x,
                    columns = c("ENTREZID", "SYMBOL"),
                    keytype = "SYMBOL")

  gene <- gene.df$ENTREZID
  gene <- gene[which(!is.na(gene))]
  gene <- unique(gene)

  return(gene)
})
## 'select()' returned 1:1 mapping between keys and columns
## 'select()' returned 1:1 mapping between keys and columns
## 'select()' returned 1:1 mapping between keys and columns
## 'select()' returned 1:1 mapping between keys and columns
## 'select()' returned 1:1 mapping between keys and columns
## 'select()' returned 1:1 mapping between keys and columns
## 'select()' returned 1:1 mapping between keys and columns
## 'select()' returned 1:1 mapping between keys and columns
## 'select()' returned 1:1 mapping between keys and columns
## 'select()' returned 1:1 mapping between keys and columns
## 'select()' returned 1:1 mapping between keys and columns
## 'select()' returned 1:1 mapping between keys and columns
## 'select()' returned 1:1 mapping between keys and columns
## 'select()' returned 1:1 mapping between keys and columns14.4 GO for gene list
 gene.ls <- geneid.ls[c(1, 2, 8)]

# her mcc for macaque
 compKEGG <- compareCluster(geneCluster   = gene.ls,
                             fun           = "enrichKEGG",
                             pvalueCutoff  = 0.05,
                              pAdjustMethod = "BH",
                            organism = "mcc")

  compGO <- compareCluster(geneCluster   = gene.ls,
                           fun           = "enrichGO",
                           pvalueCutoff  = 0.05,
                           pAdjustMethod = "BH",
                           OrgDb = org.Mmu.eg.db,
                           ont = 'BP')

#  compPathway <- compareCluster(geneCluster   = gene.ls,
#                                fun           = "enrichPathway",
#                                pvalueCutoff  = 0.05,
#                                pAdjustMethod = "BH")

## dot plot
g1 <- dotplot(compGO, showCategory = 10, title = "GO Enrichment Analysis")
#g2 <- dotplot(compPathway, showCategory = 10, title = "REACTOME Pathway Enrichment Analysis")
g3 <- dotplot(compKEGG, showCategory = 10, title = "KEGG Pathway Enrichment Analysis")
14.5 GO per cluster
## go enrichment per cluster
go.ls <- geneid.ls[c(1,2,8)] %>% map(~{
eGO <- enrichGO(
gene = .x,
OrgDb = org.Mmu.eg.db,
ont = "BP",
pAdjustMethod = "BH",
pvalueCutoff = 0.05,
readable = TRUE
)
return(eGO)
})
#pathway.ls <- gene.ls %>% map(~{
# ePathway <- enrichPathway(
# gene = .x,
# pvalueCutoff = 0.05,
# readable = TRUE,
# )
# return(ePathway)
#})
kegg.ls <- gene.ls %>% map(~{
eKEGG <- enrichKEGG(
gene = .x,
pvalueCutoff = 0.05,
organism = 'mcc'
)
return(eKEGG)
})
## enrichment visu
barplotTerm <- function(object,
x = "Count",
color = 'p.adjust',
showCategory = 8,
font.size = 12,
title = "") {
## use *height* to satisy barplot generic definition
## actually here is an enrichResult object.
colorBy <- color
df <- fortify(object, showCategory = showCategory, by = x)
df$p.adjust <- -log10(df$p.adjust)
#df <- df[c(1:3,9:12,15,16),]
if (colorBy %in% colnames(df)) {
p <-
ggplot(df, aes_string(x = x, y = "Description", fill = colorBy)) +
theme_dose(font.size) +
scale_fill_continuous(
low = "red",
high = "blue",
name = color,
guide = guide_colorbar(reverse = TRUE)
)
} else {
p <- ggplot(df, aes_string(x = x, y = "Description")) +
theme_dose(font.size) +
theme(legend.position = "none")
}
p + geom_col(fill = color) + ggtitle(title) + xlab('-log10 FDR') + ylab(NULL)
}
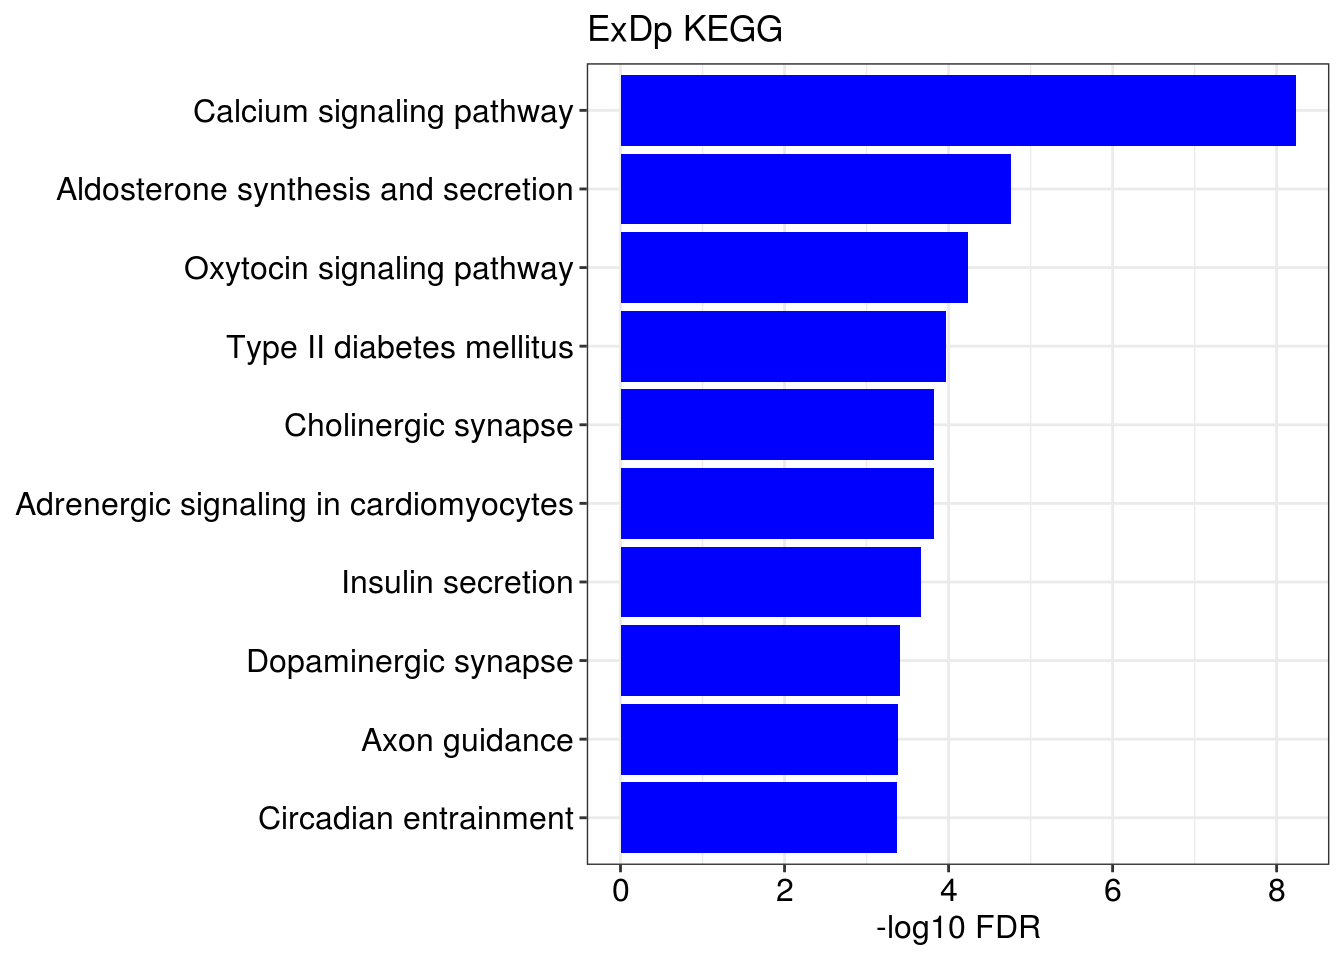
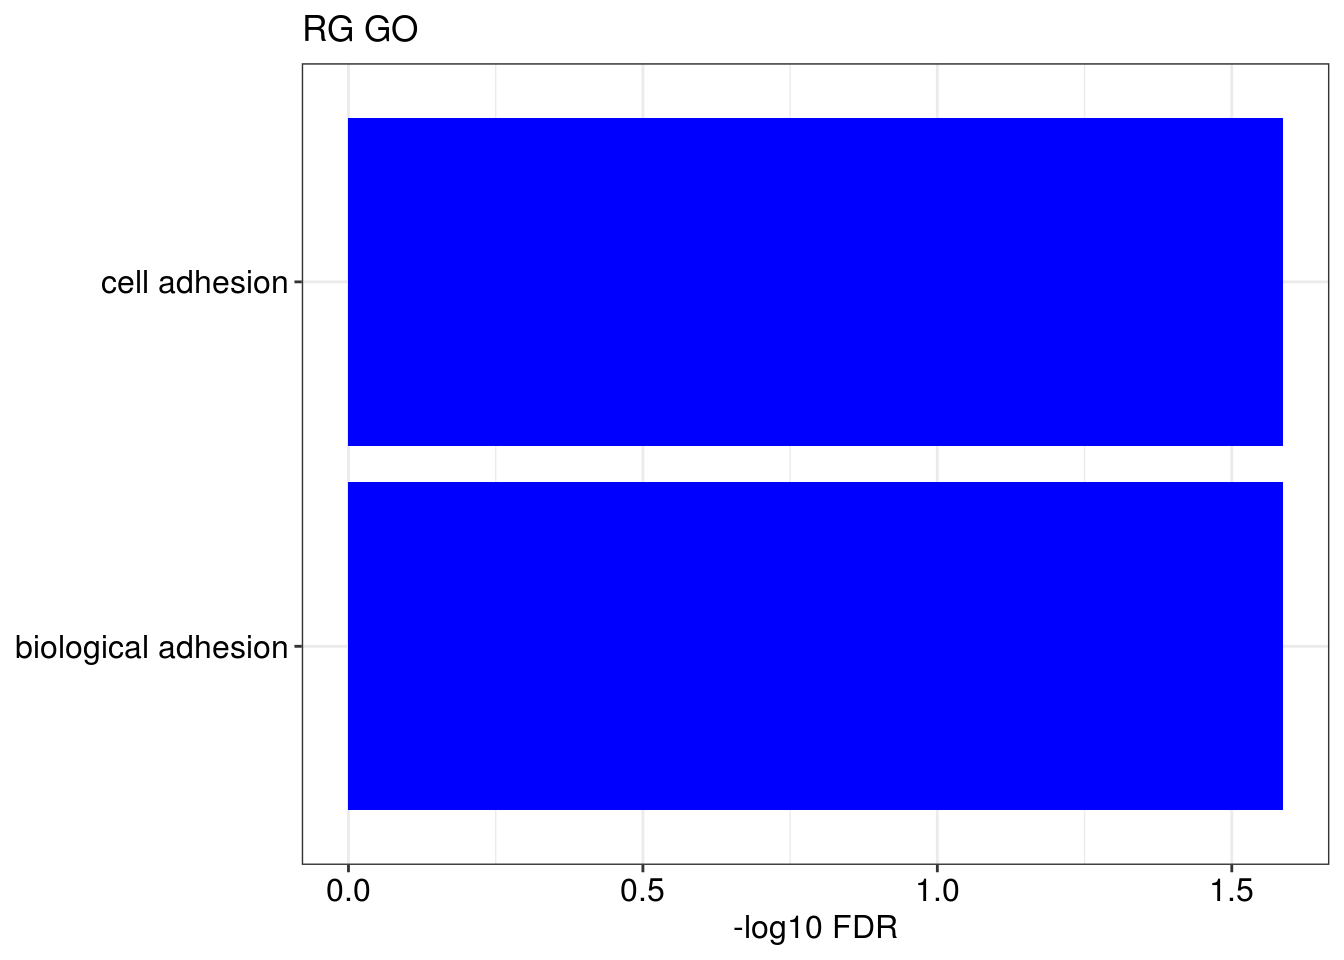
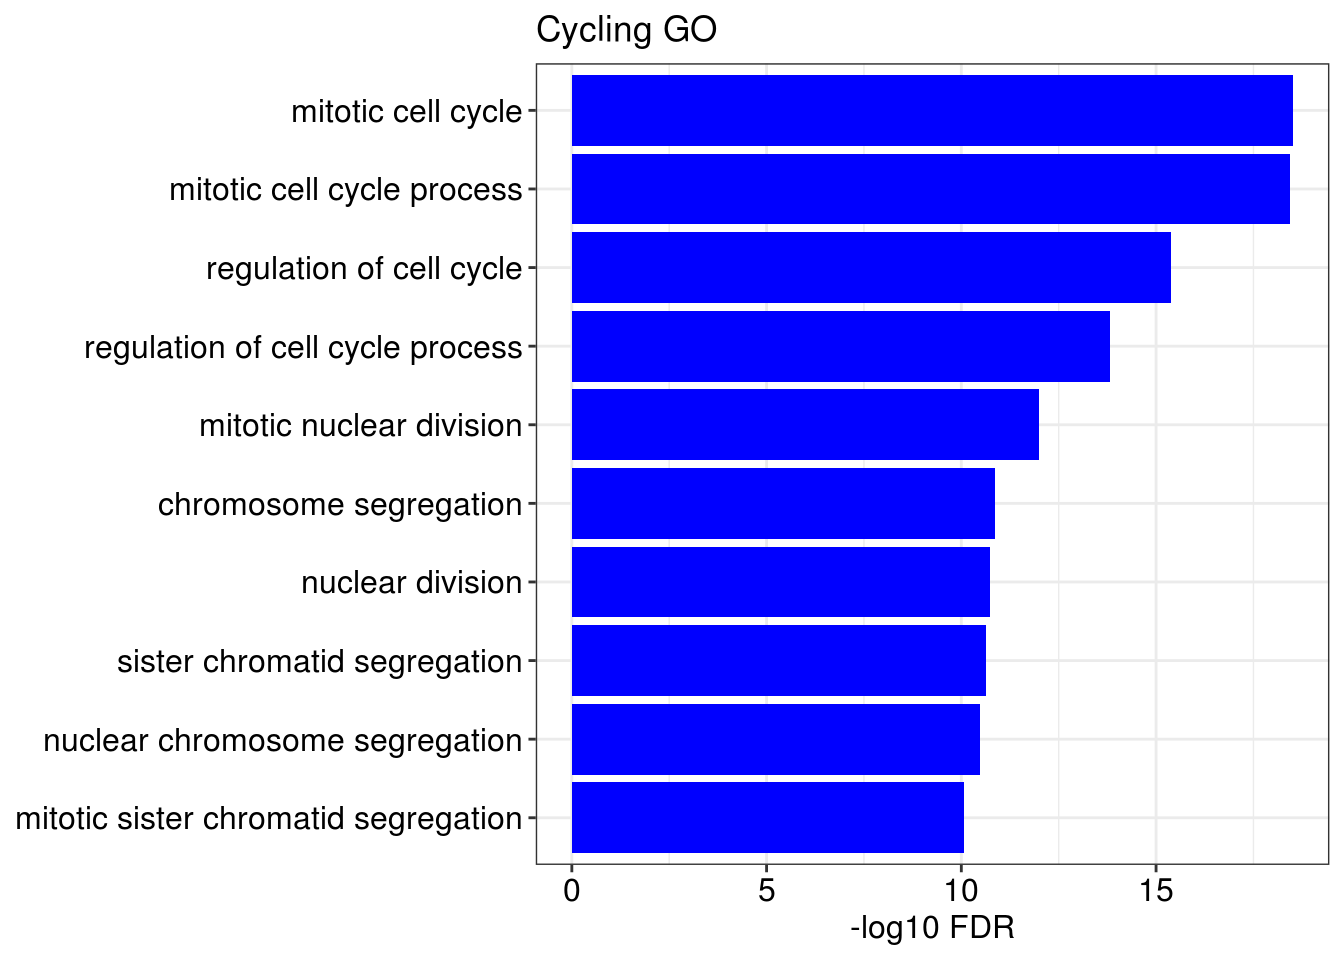
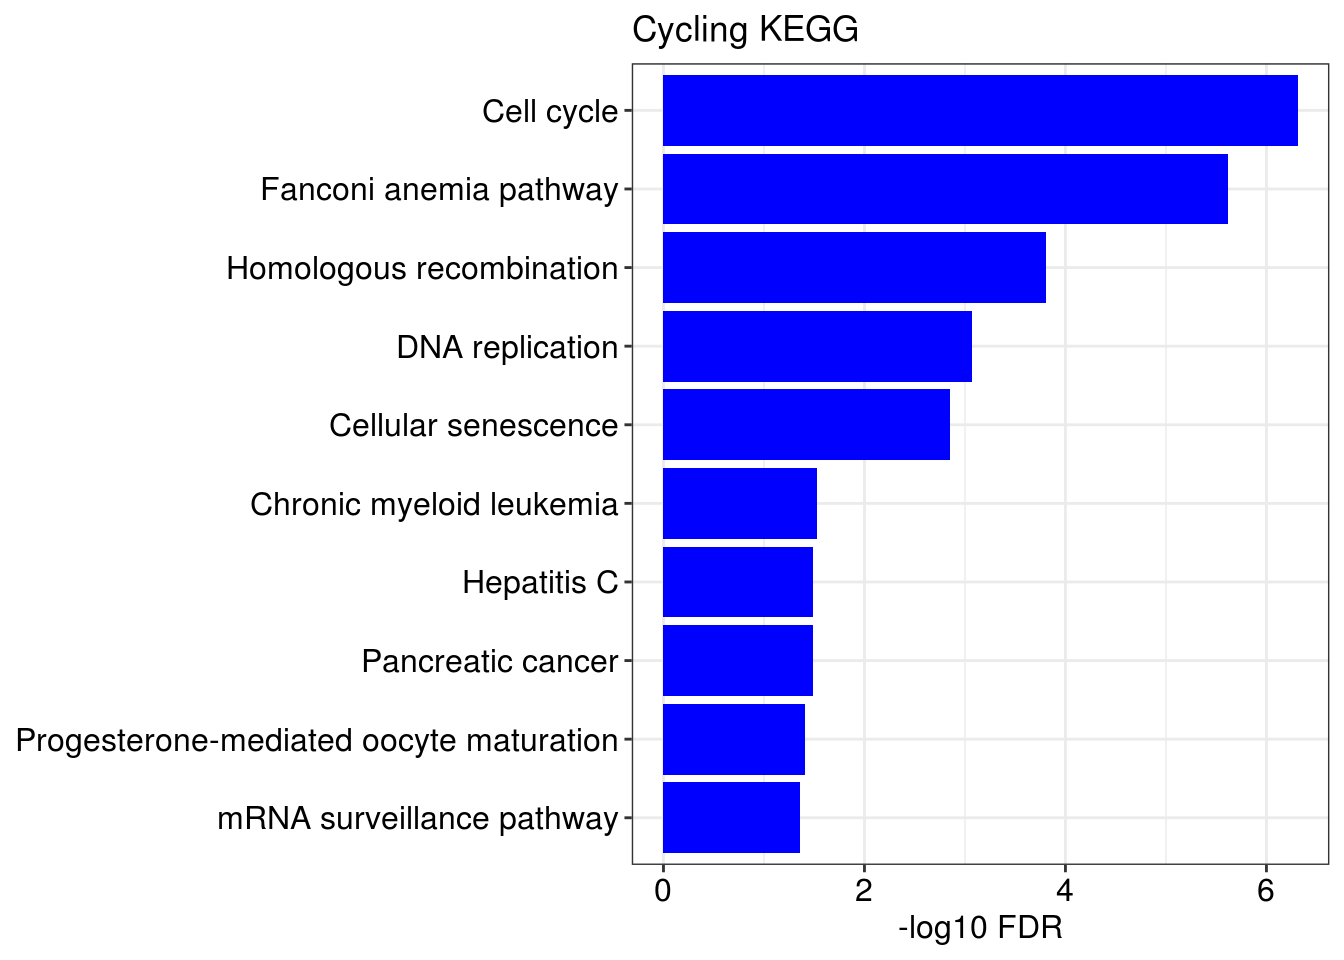
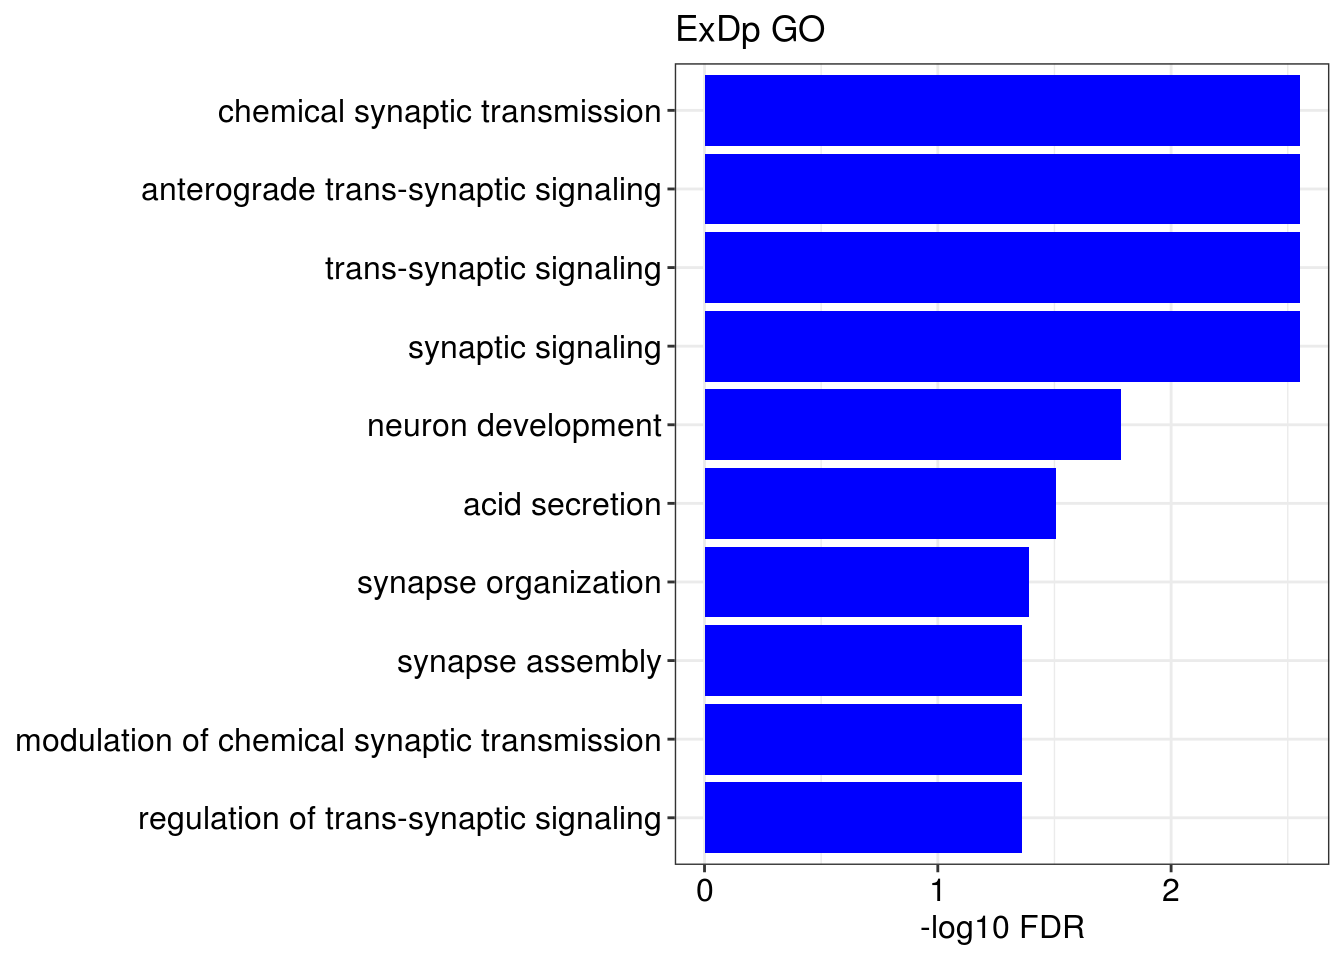
lapply(1:length(gene.ls), function(x){
name <- names(gene.ls)[[x]]
g1 = barplotTerm(go.ls[[x]], showCategory = 10, title = paste0(name, " GO"), color = 'blue', x = 'p.adjust')
g3 = barplotTerm(kegg.ls[[x]], showCategory = 10, title = paste0(name, " KEGG"), color = 'blue', x = 'p.adjust')
print(g1)
print(g3)
})


## [[1]]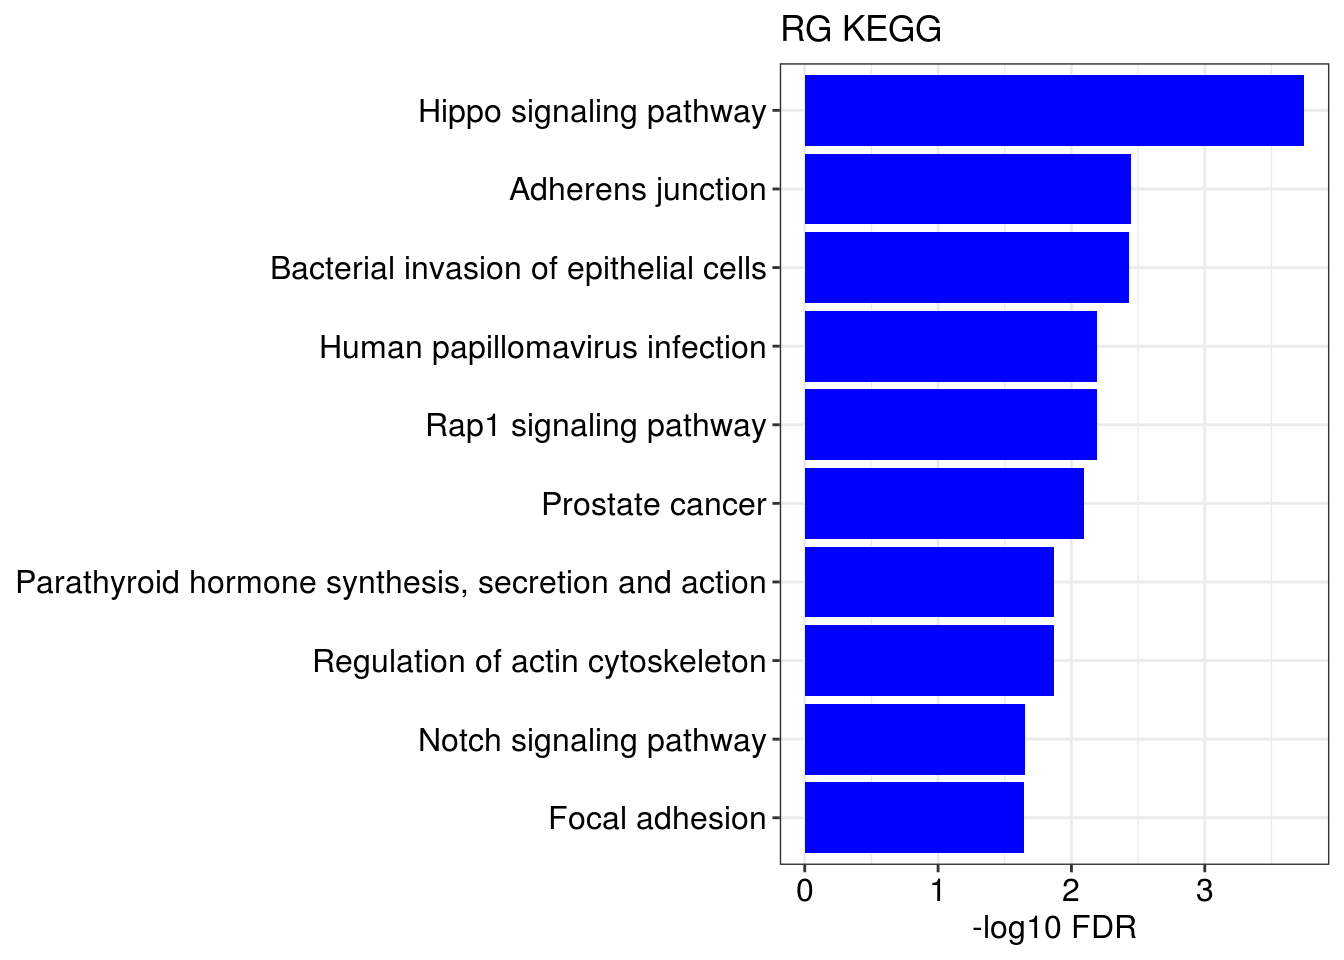
##
## [[2]]
##
## [[3]]