9 Phylogeny Example: Fish Tree of Life
library(fishtree) # Fish Tree of Life package
library(ape)
library(rfishbase) # Fishbase package
library(picante) # Phylogeny package
library(fields)
9.1 Import species from Fishbase
Fishbase (https://fishbase.org/) is a global database of fish species, distributions, ecology, morphology, and photos. First, we will bring in all species names from the family Centrarchidae, a North American family that includes basses and sunfish.
9.2 Import phylogenetic information from the Fish Tree of Life
We can then pass on this species list to the Fish Tree of Life to get a phylogeny:
## Warning: Requested 38 but only found 33 species.
## • Lepomis peltastes
## • Micropterus cahabae
## • Micropterus chattahoochae
## • Micropterus tallapoosae
## • Micropterus warriorensis
9.3 Plot a basic phylogeny
We can then plot the Centarchid species phylogeny for species with placement
# Plot the tree
plot.phylo(
  phy,
  type = "phylogram",           # "phylogram", "cladogram", or "fan" for radial
  cex = 0.8,              # Size of tip labels
  font = 3,               # Italic font for species names
  no.margin = FALSE,
  label.offset = 0.02,    # Spacing between tip and label
  edge.width = 2          # Thicker branches
)
title("Phylogenetic Tree of the 33 placed Centrarchid species")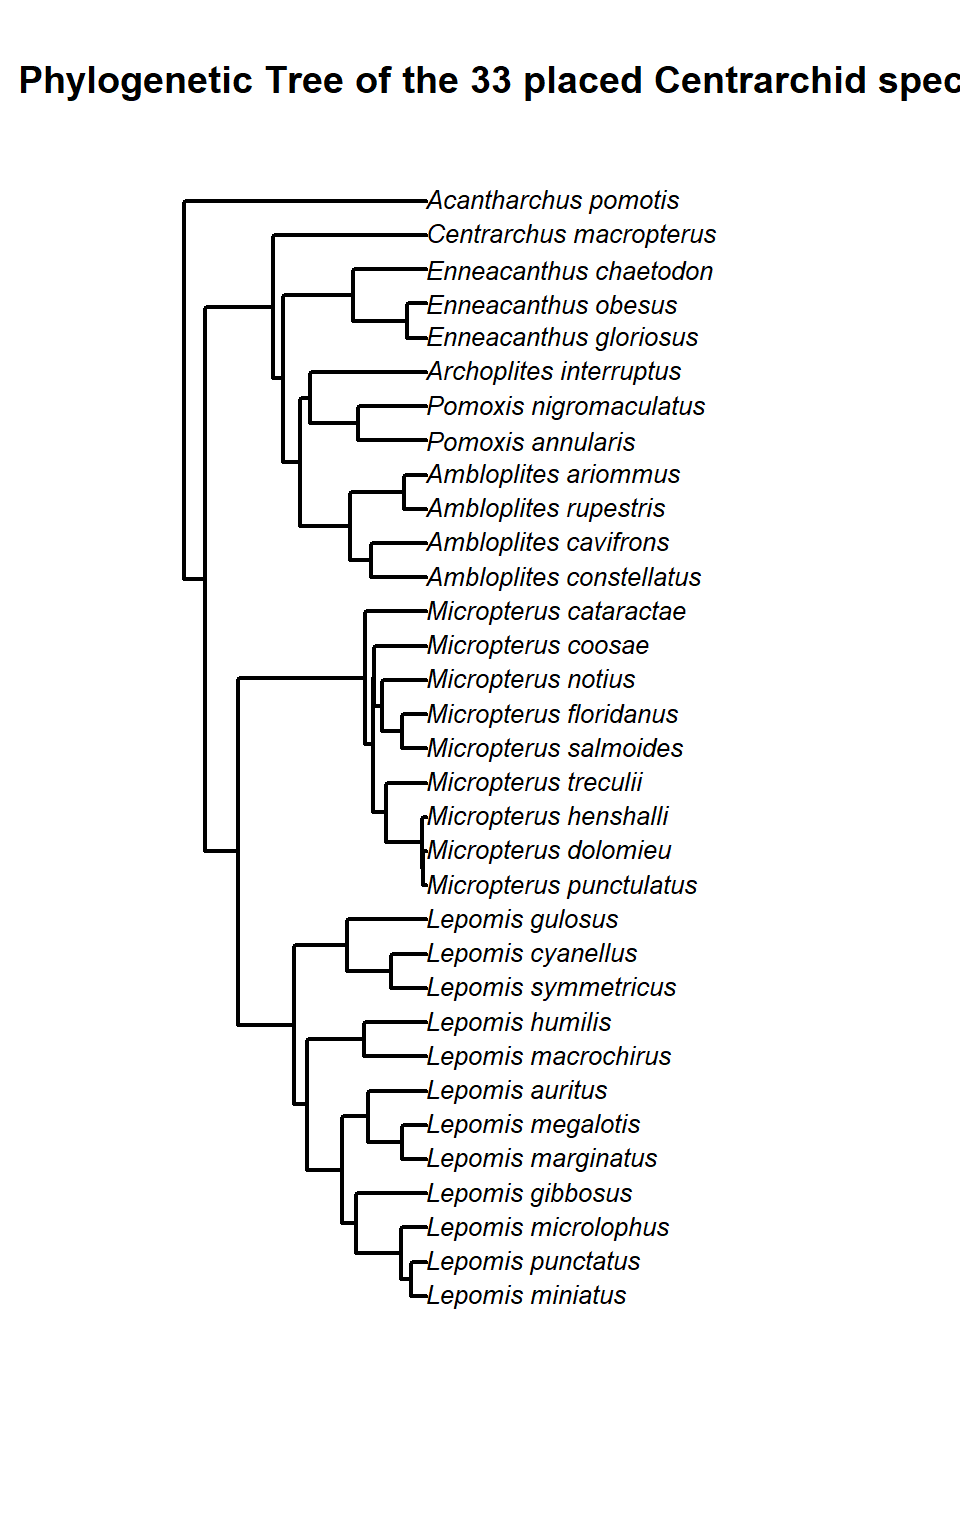
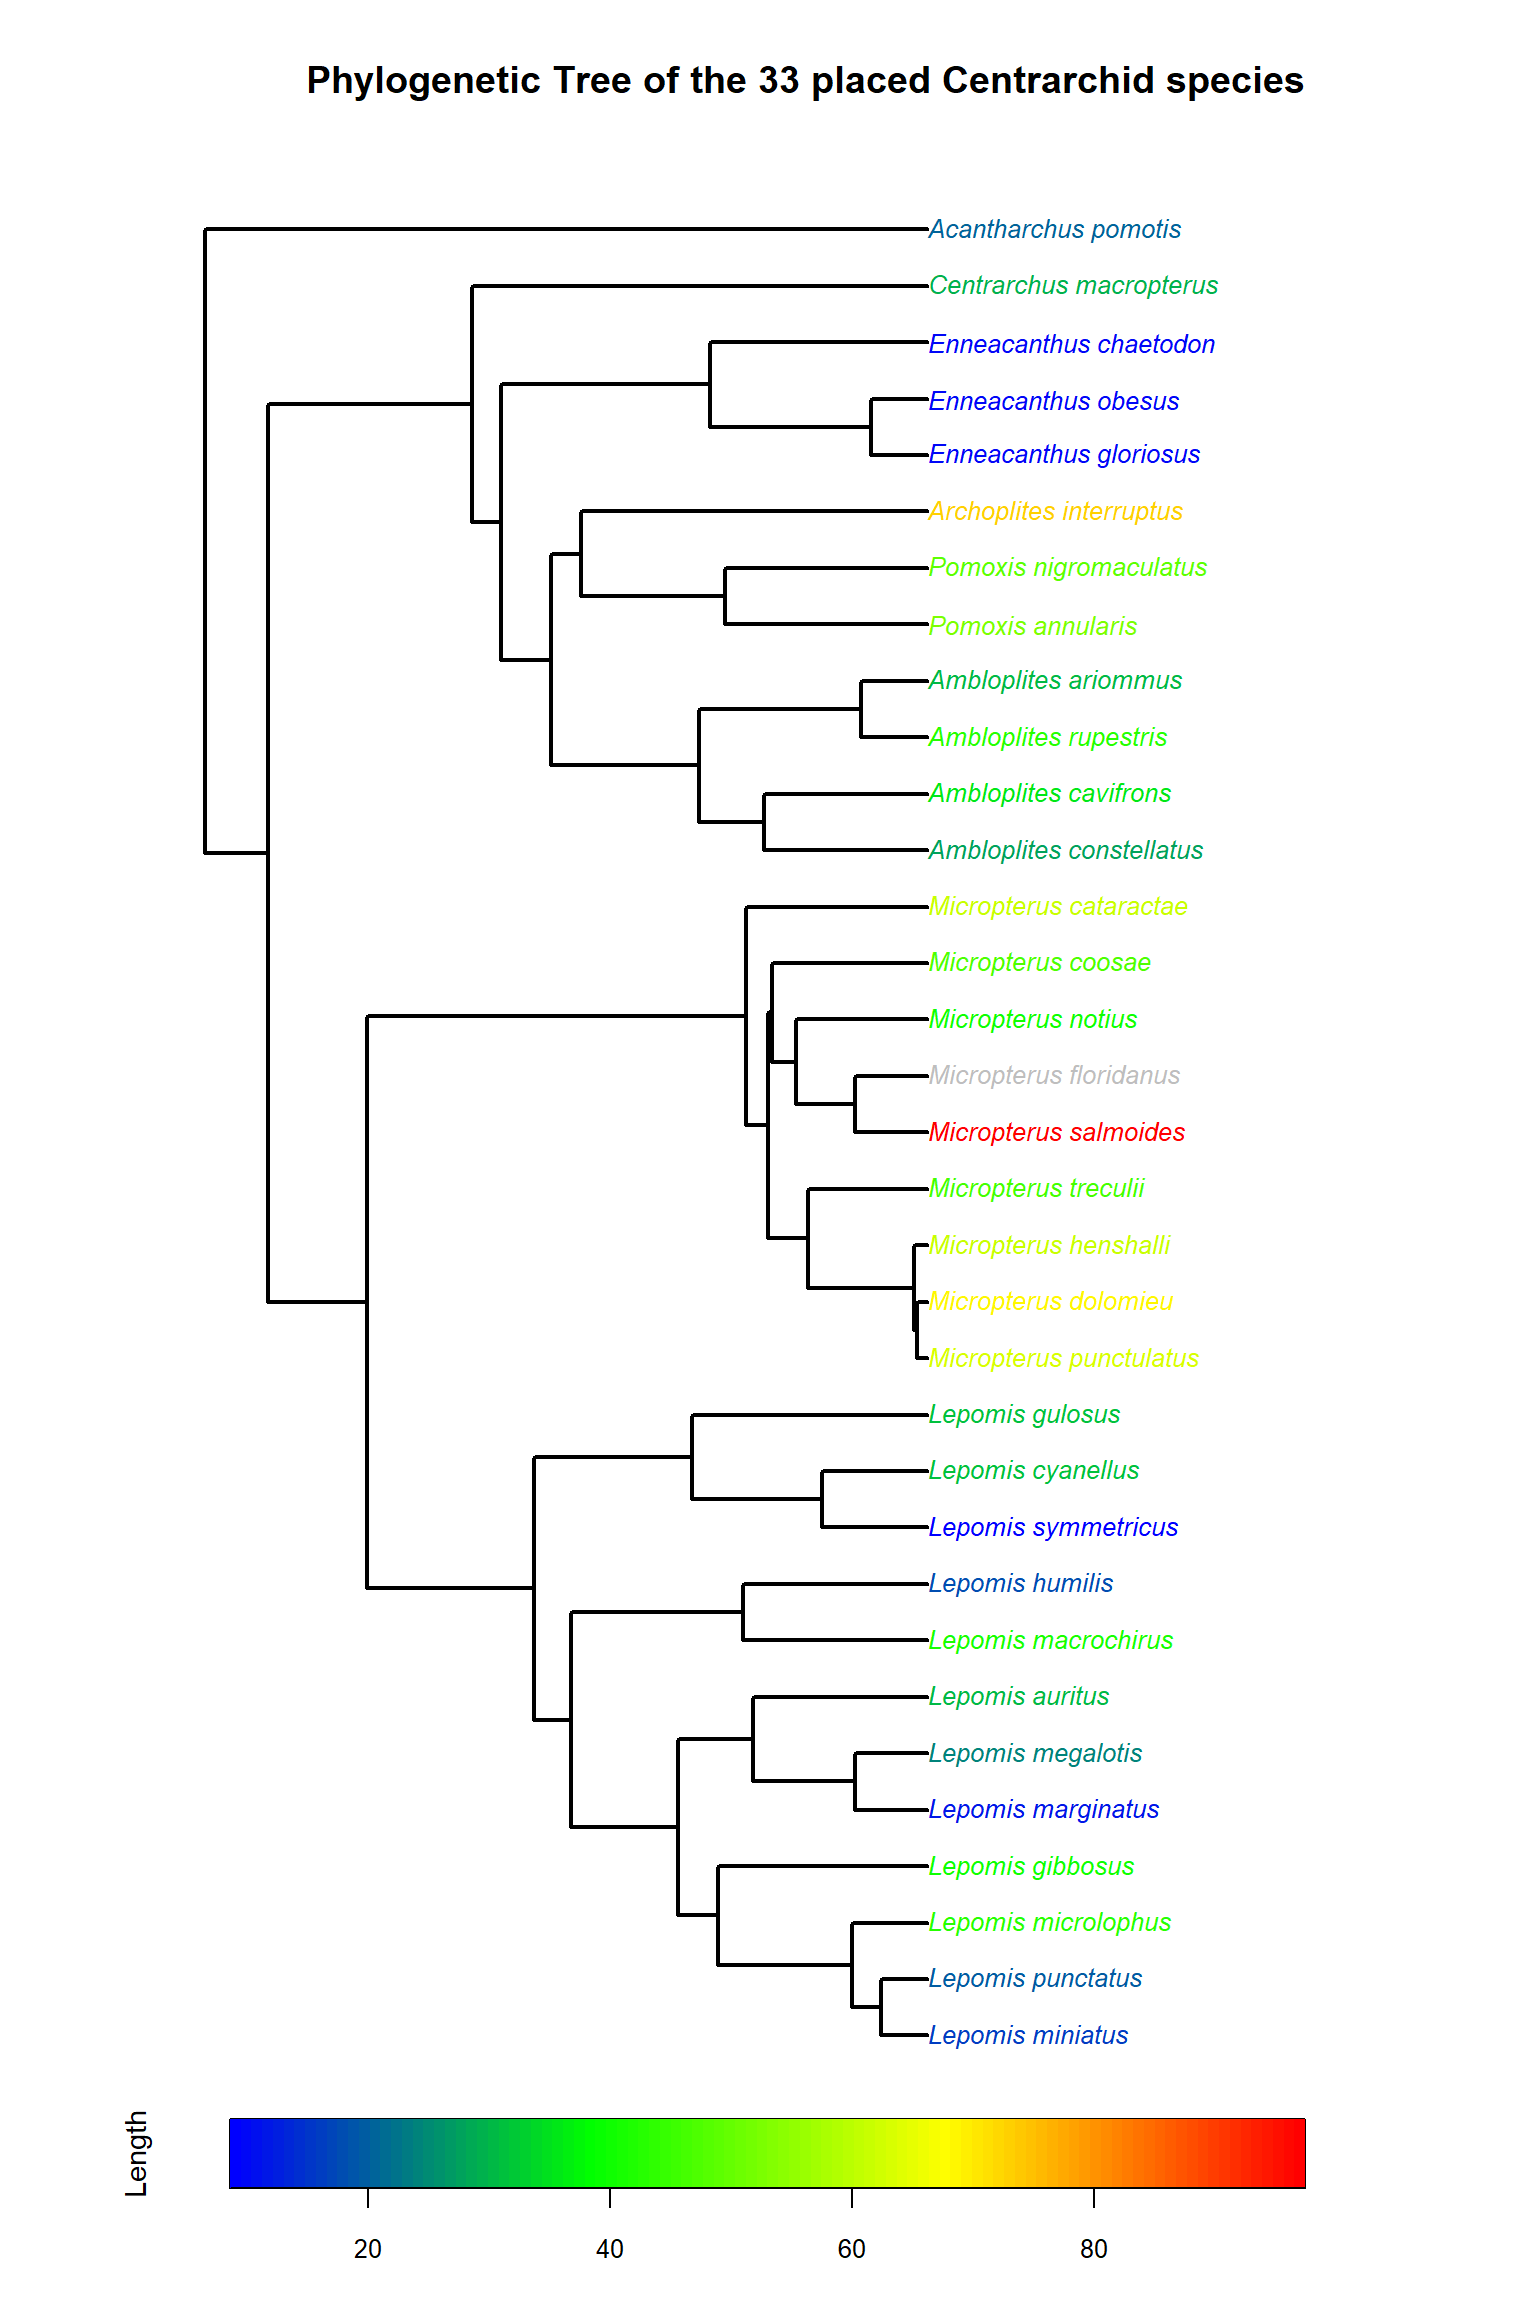
9.4 Annotating a phylogeny
We can also do things like annotate our phylogeny using some of the other data from Fishbase.
# Clean tip labels for matching
phy_labels_clean <- gsub("_", " ", phy$tip.label)

# Match lengths
lengths <- centrarchids$Length[match(phy_labels_clean, centrarchids$gensp)]

# Build color palette
color_palette <- colorRampPalette(c("blue", "green", "yellow", "red"))
n_colors <- 100
colors <- color_palette(n_colors)

# Scale length values to color indices
length_scaled <- round(scales::rescale(lengths, to = c(1, n_colors)))

# Assign colors, defaulting to gray for NA values
tip_colors <- ifelse(is.na(length_scaled), "gray", colors[length_scaled])

plot.phylo(
  phy,
  type = "phylogram",
  cex = 0.8,
  font = 3,
  tip.color = tip_colors,
  no.margin = FALSE,
  label.offset = 0.02,
  edge.width = 2
)
title("Phylogenetic Tree of the 33 placed Centrarchid species")

if (any(!is.na(lengths))) {
  legend_gradient <- matrix(seq(min(lengths, na.rm = TRUE), max(lengths, na.rm = TRUE), length.out = n_colors), ncol = 1)
  image.plot(
    z = legend_gradient,
    col = colors,
    legend.only = TRUE,
    horizontal = TRUE,
    legend.width = 1.2,
    legend.shrink = 0.6,
    smallplot = c(0.15, 0.85, 0.05, 0.08),
    axis.args = list(
      at = pretty(range(lengths, na.rm = TRUE)),
      labels = pretty(range(lengths, na.rm = TRUE)),
      cex.axis = 0.8
    ),
    legend.args = list(text = "Length", side = 2, line = 2, cex = 0.9)
  )
}