In this document for illustration purposes we will use the Sepages phenols pregnancy data:
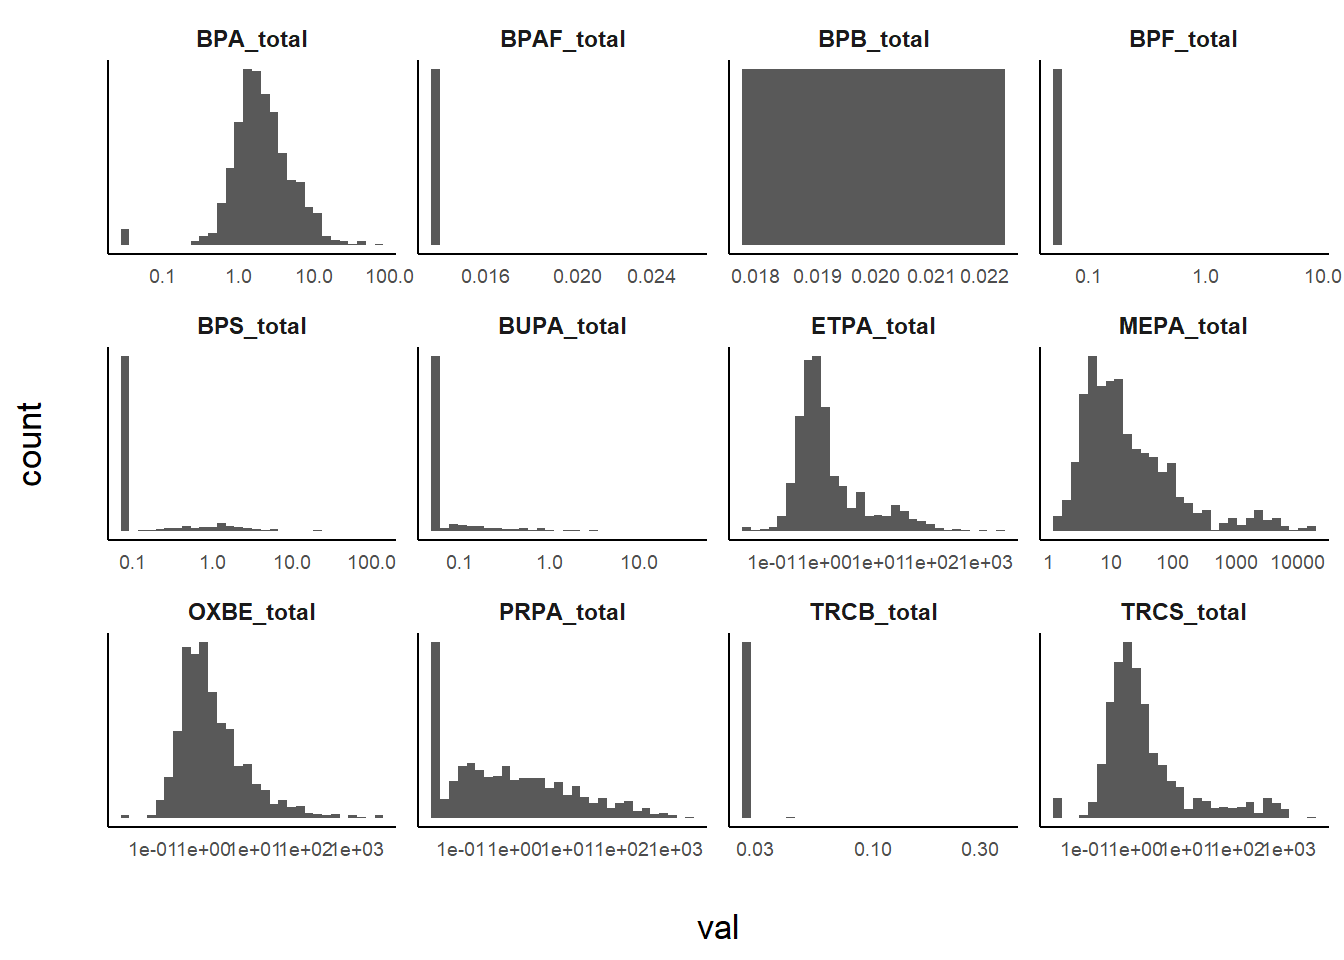
Figure 1.1: Distribution of the raw concentrations for each phenols, log10 scale