1 Your first shiny app
1.1 Introduction
Objectives for Chapter 01
- Using the minimum boilerplate needed for a Shiny app (Section 1.2)
- How to start and stop a Shiny app (Section 1.3)
- UI is short for user interface, which defines how your app looks (Section 1.4)
- Server function defines how your app works (Section 1.5)
- Reactive expressions as Shiny uses reactive programming to automatically update outputs when inputs change (Section 1.6)
1.2 Create app directory and file
There are several ways to create a Shiny app. I am using the following procedure:
Procedure 1.1 : My preferred procedure to create a Shiny app
- In RStudio choose
File | New File > Shiny Web App… - In the window fill in the application name.
- This will create the directory with the file
app.Rin the directory. Additionally it will openapp.Rwith a boiler template. - Delete the boiler template, e.g. the whole content of the
app.Rfile. - Type
sh1followed byShift TABfor my own boiler template1 with the following content:
See the help documentation for creating Code Snippets in the RStudio IDE.
Putting “Hello World” into the shiny::fluidPage() function results in the most basic example:
Code Collection 1.1 : Most basic {shiny} example
R Code 1.1 : Most basic {shiny} example
- It calls
library(shiny) to load the shiny package. - It defines the user interface, the HTML webpage that humans interact with. In this case, it’s a page containing the words “Hello, world!”.
- It specifies the behaviour of our app by defining a server function. It’s currently empty, so our app doesn’t do anything, but we’ll be back to revisit this shortly.
- It executes
shinyApp(ui, server)to construct and start a Shiny application from UI and server.
R Code 1.2 : Minimum {shiny} example
1.3 Running and stopping
There are a few ways to run the app:
- Click the
Run Appbutton in the document toolbar. - Use the keyboard shortcut on macOS:
Cmd + Shift + Enter.
By choosing one of the options under the Run Appbutton you can specify if you want the results presented
- in an extra browser window (shortcut:
Alt + Shift + W) - in the RStudio viewer pane (shortcut:
Alt + Shift + V) or - run external in your default browser (shortcut:
Alt + Shift + E).
In the console I found the
Listening on http://127.0.0.1:5959
This tells me the URL where your app can be found: 127.0.0.1 is a standard address that means “this computer” and 5959 is a randomly assigned port number. Entering that URL into any compatible web browser opens another copy of the Shiny app.
The red stop sign in the top right console window means that R is busy. I have to stop the app before I can write commands in the console. There are several options to stop the server:
- Click on the stop sign
- Click in the console and type ESC
- Close the Shiny app window(s)
To speed up the development process you don’t need to stop and restart the server to see the changes. When the server is running the button Run app changes to Reload app. Click on it or use the Cmd + Shift + Enter keyboard shortcut to reload the (changed) app.
1.4 Adding UI controls
Replace your ui with this code:
Code Collection 1.2 : Add UI controls
R Code 1.3 : Add UI controls
Code
library(shiny)

ui <- fluidPage(
  selectInput("dataset", label = "Dataset", choices = ls("package:datasets")),
  verbatimTextOutput("summary"),
  tableOutput("table")
)

server <- function(input, output, session) {

}

shinyApp(ui, server)
This example uses four new functions:
-
shiny::fluidPage()is a layout function that sets up the basic visual structure of the page. (See Section 6.2) -
shiny::selectInput()is an input control that lets the user interact with the app by providing a value. In this case, it’s a select box with the label “Dataset” and lets you choose one of the built-in datasets that come with R. (See Section 2.2) -
shiny::verbatimTextOutput()is an output control that tell Shiny where to put rendered output, in this case where to display code. -
shiny::tableOutput()is another output controls that displays tables. (For output controls see Section 2.3)
Layout functions, inputs, and outputs have different uses, but they are fundamentally the same under the covers: they’re all just fancy ways to generate HTML, and if you call any of them outside of a Shiny app, you’ll see HTML printed out at the console.
For instance:
> shiny::tableOutput("table") # results into:
<div id="table" class="shiny-html-output"></div>
Running the app again we’ll see a page containing a select box. We only see the input, not the two outputs, because we haven’t yet told Shiny how the input and outputs are related.
1.5 Adding behaviour
Shiny uses reactive programming to make apps interactive. (More about reactive programming in Chapter 3.) For now, just be aware that it involves telling Shiny how to perform a computation, not ordering Shiny to actually go do it.
We’ll tell Shiny how to fill in the summary and table outputs in the sample app by providing the “recipes” for those outputs. Replace your empty server function the folowing code:
Code Collection 1.3 : Add behaviour
R Code 1.5 : Add behaviour
Code
library(shiny)

ui <- fluidPage(
  selectInput("dataset", label = "Dataset", choices = ls("package:datasets")),
  verbatimTextOutput("summary"),
  tableOutput("table")
)

server <- function(input, output, session) {
  output$summary <- renderPrint({
    dataset <- get(input$dataset, "package:datasets")
    summary(dataset)
  })

  output$table <- renderTable({
    dataset <- get(input$dataset, "package:datasets")
    dataset
  })
}

shinyApp(ui, server)- The left-hand side of the assignment operator (
<-),output$ID, indicates that you’re providing the recipe for the Shiny output with that ID. - The right-hand side of the assignment uses a specific render function to wrap some code that you provide. Each
render{Type}function is designed to produce a particular type of output (e.g. text, tables, and plots), and is often paired with a{type}Outputfunction. For example, in this app,shiny::renderPrint()is paired withshiny::verbatimTextOutput()to display a statistical summary with fixed-width (verbatim) text, andshiny::renderTable()is paired withshiny::tableOutput()to show the input data in a table.
Notice that the summary and table update whenever you change the input dataset. This dependency is created implicitly because we’ve referred to shiny::input$dataset() within the output functions. shiny::input$dataset() is populated with the current value of the UI component with id dataset, and will cause the outputs to automatically update whenever that value changes. This is the essence of reactivity: outputs automatically react (recalculate) when their inputs change.
1.6 Reducing duplication with reactive expressions
The following line is duplicated:
dataset <- get(input$dataset, "package:datasets")In traditional R scripting, we use two techniques to deal with duplicated code: either we capture the value using a variable, or capture the computation with a function. Unfortunately neither of these approaches work here, for reasons you’ll learn about in Section 13.2. Therefore we need a new mechanism: reactive expressions.
You create a reactive expression by wrapping a block of code in reactive({...}) and assigning it to a variable, and you use a reactive expression by calling it like a function. But while it looks like you’re calling a function, a reactive expression has an important difference: it only runs the first time it is called and then it caches its result until it needs to be updated.
We can update our shiny::server() function to use reactive expressions, as shown below. The app behaves identically, but works a little more efficiently because it only needs to retrieve the dataset once, not twice.
Code Collection 1.4 : Add reactive expression
R Code 1.7 : Add reactive expression to simplify the code
Code
library(shiny)

ui <- fluidPage(
  selectInput("dataset", label = "Dataset", choices = ls("package:datasets")),
  verbatimTextOutput("summary"),
  tableOutput("table")
)

server <- function(input, output, session) {
  # Create a reactive expression
  dataset <- reactive({
    get(input$dataset, "package:datasets")
  })

  output$summary <- renderPrint({
    # Use a reactive expression by calling it like a function
    summary(dataset())
  })

  output$table <- renderTable({
    dataset()
  })
}

shinyApp(ui, server)1.7 Summary
In this chapter we’ve created a simple app.
Resource 1.1 : Shiny cheatsheet
To remember the shiny components and functions download and use the shiny cheatsheet.
1.8 Exercises
1.8.1 Example 1: Greeting app
Create an app that greets the user by name. You don’t know all the functions you need to do this yet, so I’ve included some lines of code below.
Exercise 1.1 : Greeting app
Think about which lines you’ll use and then copy and paste them into the right place in a Shiny app.
R Code 1.9 : Greeting app
Which lines of code in which place for a Shiny greeting app?
tableOutput("mortgage")
output$greeting <- renderText({
  paste0("Hello ", input$name)
})
numericInput("age", "How old are you?", value = NA)
textInput("name", "What's your name?")
textOutput("greeting")
output$histogram <- renderPlot({
  hist(rnorm(1000))
}, res = 96)
Solution 1.1. : Greeting app
Code
library(shiny)

ui <- fluidPage(
    textInput("name", "What's your name?"),
    textOutput("greeting")
)

server <- function(input, output, session) {
    output$greeting <- renderText({
        paste0("Hello ", input$name)
    })
}

shinyApp(ui, server)
1.8.2 Example 2: Multiply x with 5
Suppose your friend wants to design an app that allows the user to set a number (x) between 1 and 50, and displays the result of multiplying this number by 5.
This is their first attempt but it has an error.
Exercise 1.2 : Multiply x with 5
R Code 1.10 : Multiply x with 5
Correct the error
library(shiny)

ui <- fluidPage(
  sliderInput("x", label = "If x is", min = 1, max = 50, value = 30),
  "then x times 5 is",
  textOutput("product")
)

server <- function(input, output, session) {
  output$product <- renderText({
    x * 5
  })
}

shinyApp(ui, server)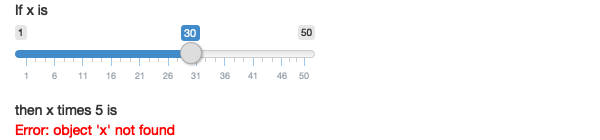
Solution 1.3. : Multiply x with 5
Code
library(shiny)

ui <- fluidPage(
    sliderInput("x", label = "If x is", min = 1, max = 50, value = 30),
    "then x times 5 is",
    textOutput("product")
)

server <- function(input, output, session) {
    output$product <- renderText({
        input$x * 5
    })
}

shinyApp(ui, server)
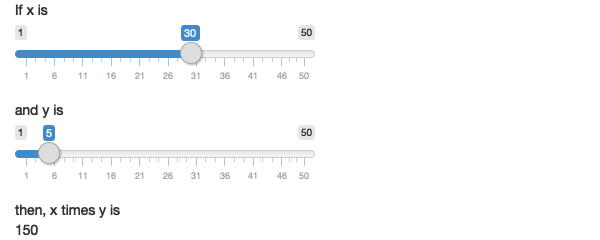
1.8.3 Example 3: Multiply x with y
Exercise 1.3 : Multiply x with y
Extend the app from the previous exercise to allow the user to set the value of the multiplier, y, so that the app yields the value of x * y. The final result should look like this:.
Solution 1.5. : Multiply x with y
Code
library(shiny)

ui <- fluidPage(
    sliderInput("x", label = "If x is", min = 1, max = 50, value = 30),
    sliderInput("y", label = "and y is", min = 1, max = 50, value = 5),
    "then x times y is",
    textOutput("product")
)

server <- function(input, output, session) {
    output$product <- renderText({
        input$x * input$y
    })
}

shinyApp(ui, server)1.8.4 Example 4: Use reactive expression
Take the following app which adds some additional functionality to the last app described in the last exercise. What’s new? How could you reduce the amount of duplicated code in the app by using a reactive expression.
Exercise 1.4 : Simplify code with a reactive expression
R Code 1.11 : Simplify code with a reactive expression
Use a reactive expression
library(shiny)

ui <- fluidPage(
  sliderInput("x", "If x is", min = 1, max = 50, value = 30),
  sliderInput("y", "and y is", min = 1, max = 50, value = 5),
  "then, (x * y) is", textOutput("product"),
  "and, (x * y) + 5 is", textOutput("product_plus5"),
  "and (x * y) + 10 is", textOutput("product_plus10")
)

server <- function(input, output, session) {
  output$product <- renderText({
    product <- input$x * input$y
    product
  })
  output$product_plus5 <- renderText({
    product <- input$x * input$y
    product + 5
  })
  output$product_plus10 <- renderText({
    product <- input$x * input$y
    product + 10
  })
}

shinyApp(ui, server)
Solution 1.7. : Simplify code with a reactive expression
Code
library(shiny)

ui <- fluidPage(
    sliderInput("x", "If x is", min = 1, max = 50, value = 30),
    sliderInput("y", "and y is", min = 1, max = 50, value = 5),
    "then, (x * y) is", textOutput("product"),
    "and, (x * y) + 5 is", textOutput("product_plus5"),
    "and (x * y) + 10 is", textOutput("product_plus10")
)

server <- function(input, output, session) {
    # Create a reactive expression
    product <- reactive({
        input$x * input$y
    })

    output$product <- renderText({
        product()
    })
    output$product_plus5 <- renderText({
        product() + 5
    })
    output$product_plus10 <- renderText({
        product() + 10
    })
}

shinyApp(ui, server)1.8.5 Example 5: Find three bugs
The following app is very similar to one you’ve seen earlier in the chapter: you select a dataset from a package (this time we’re using the {ggplot2} package) and the app prints out a summary and plot of the data. It also follows good practice and makes use of reactive expressions to avoid redundancy of code. However there are three bugs in the code provided below. Can you find and fix them?
Exercise 1.5 : Find three bugs
R Code 1.12 : Find three bugs
Find three bugs
library(shiny)
library(ggplot2)

datasets <- c("economics", "faithfuld", "seals")
ui <- fluidPage(
  selectInput("dataset", "Dataset", choices = datasets),
  verbatimTextOutput("summary"),
  tableOutput("plot")
)

server <- function(input, output, session) {
  dataset <- reactive({
    get(input$dataset, datasets)
  })
  output$summary <- renderPrint({
    summary(dataset())
  })
  output$plot <- renderPlot({
    plot(dataset)
  }, res = 96)
}

shinyApp(ui, server)
Solution 1.9. : Find three bugs
Code
library(shiny)
library(ggplot2)
library(munsell)

datasets <- c("economics", "faithfuld", "seals")
ui <- fluidPage(
    selectInput("dataset", label = "Dataset", choices = datasets),
    verbatimTextOutput("summary"),
    plotOutput("plot")
)

server <- function(input, output, session) {
    dataset <- reactive({
        get(input$dataset)
    })
    output$summary <- renderPrint({
        summary(dataset())
    })
    output$plot <- renderPlot({
        plot(dataset())
    }, res = 96)
}

shinyApp(ui, server)
Solution 1.10. : Find three bugs
#| '!! shinylive warning !!': |
#|   shinylive does not work in self-contained HTML documents.
#|   Please set `embed-resources: false` in your metadata.
#| standalone: true
#| viewerHeight: 600

library(shiny)
library(ggplot2)
library(munsell)

my_datasets <- c("economics", "faithfuld", "seals")
ui <- fluidPage(
    selectInput("dataset", label = "Dataset", choices = my_datasets),
    verbatimTextOutput("summary"),
    plotOutput("plot")
)

server <- function(input, output, session) {
    dataset <- reactive({
        get(input$dataset)
    })
    output$summary <- renderPrint({
        summary(dataset())
    })
    output$plot <- renderPlot({
        plot(dataset())
    }, res = 96)
}

shinyApp(ui, server)
This code chunk works as a standalone {shiny} app without the code line library(munsell). This difference concerns each {shinylive} code chunk where {ggplot2} is used. — I should report this in the appropriate forum.
1.9 Glossary Entries
| term | definition |
|---|---|
| Reactive expressions | Reactive expressions are a key component of reactive programming in Shiny. They are R expressions that use widget input and return a value, updating this value whenever the original widget changes. Reactive expressions cache their values and know when their values have become outdated, which helps in preventing unnecessary re-computation and makes the app faster. |
| Reactive programming | Reactive programming in R Shiny is a coding style that focuses on managing values that change over time and orchestrating actions based on those changes. This feature is crucial for Shiny applications because users interact with dynamic controls like sliders and checkboxes, which trigger server-side processes, such as data retrieval and updates to output elements. In Shiny, reactive programming creates a dynamic link between inputs and outputs, ensuring that outputs refresh automatically when there's a change in inputs. |
Session Info
Session Info
Code
sessioninfo::session_info()#> ─ Session info ───────────────────────────────────────────────────────────────
#> setting value
#> version R version 4.5.1 (2025-06-13)
#> os macOS Sequoia 15.5
#> system aarch64, darwin20
#> ui X11
#> language (EN)
#> collate en_US.UTF-8
#> ctype en_US.UTF-8
#> tz Europe/Vienna
#> date 2025-07-19
#> pandoc 3.7.0.2 @ /opt/homebrew/bin/ (via rmarkdown)
#> quarto 1.8.4 @ /usr/local/bin/quarto
#>
#> ─ Packages ───────────────────────────────────────────────────────────────────
#> package * version date (UTC) lib source
#> cli 3.6.5 2025-04-23 [1] CRAN (R 4.5.0)
#> codetools 0.2-20 2024-03-31 [1] CRAN (R 4.5.0)
#> commonmark 2.0.0 2025-07-07 [1] CRAN (R 4.5.0)
#> curl 6.4.0 2025-06-22 [1] CRAN (R 4.5.0)
#> dichromat 2.0-0.1 2022-05-02 [1] CRAN (R 4.5.0)
#> digest 0.6.37 2024-08-19 [1] CRAN (R 4.5.0)
#> evaluate 1.0.4 2025-06-18 [1] CRAN (R 4.5.0)
#> farver 2.1.2 2024-05-13 [1] CRAN (R 4.5.0)
#> fastmap 1.2.0 2024-05-15 [1] CRAN (R 4.5.0)
#> glossary * 1.0.0.9003 2025-06-08 [1] local
#> glue 1.8.0 2024-09-30 [1] CRAN (R 4.5.0)
#> htmltools 0.5.8.1 2024-04-04 [1] CRAN (R 4.5.0)
#> htmlwidgets 1.6.4 2023-12-06 [1] CRAN (R 4.5.0)
#> jsonlite 2.0.0 2025-03-27 [1] CRAN (R 4.5.0)
#> kableExtra 1.4.0 2024-01-24 [1] CRAN (R 4.5.0)
#> knitr 1.50 2025-03-16 [1] CRAN (R 4.5.0)
#> lifecycle 1.0.4 2023-11-07 [1] CRAN (R 4.5.0)
#> litedown 0.7 2025-04-08 [1] CRAN (R 4.5.0)
#> magrittr 2.0.3 2022-03-30 [1] CRAN (R 4.5.0)
#> markdown 2.0 2025-03-23 [1] CRAN (R 4.5.0)
#> R6 2.6.1 2025-02-15 [1] CRAN (R 4.5.0)
#> RColorBrewer 1.1-3 2022-04-03 [1] CRAN (R 4.5.0)
#> rlang 1.1.6 2025-04-11 [1] CRAN (R 4.5.0)
#> rmarkdown 2.29 2024-11-04 [1] CRAN (R 4.5.0)
#> rstudioapi 0.17.1 2024-10-22 [1] CRAN (R 4.5.0)
#> rversions 2.1.2 2022-08-31 [1] CRAN (R 4.5.0)
#> scales 1.4.0 2025-04-24 [1] CRAN (R 4.5.0)
#> sessioninfo 1.2.3 2025-02-05 [1] CRAN (R 4.5.0)
#> stringi 1.8.7 2025-03-27 [1] CRAN (R 4.5.0)
#> stringr 1.5.1 2023-11-14 [1] CRAN (R 4.5.0)
#> svglite 2.2.1 2025-05-12 [1] CRAN (R 4.5.0)
#> systemfonts 1.2.3 2025-04-30 [1] CRAN (R 4.5.0)
#> textshaping 1.0.1 2025-05-01 [1] CRAN (R 4.5.0)
#> vctrs 0.6.5 2023-12-01 [1] CRAN (R 4.5.0)
#> viridisLite 0.4.2 2023-05-02 [1] CRAN (R 4.5.0)
#> xfun 0.52 2025-04-02 [1] CRAN (R 4.5.0)
#> xml2 1.3.8 2025-03-14 [1] CRAN (R 4.5.0)
#> yaml 2.3.10 2024-07-26 [1] CRAN (R 4.5.0)
#>
#> [1] /Library/Frameworks/R.framework/Versions/4.5-arm64/library
#> [2] /Library/Frameworks/R.framework/Versions/4.5-arm64/Resources/library
#> * ── Packages attached to the search path.
#>
#> ──────────────────────────────────────────────────────────────────────────────This works only in places where programming code is expected (and not in Markdown text passages).↩︎