7 Descriptive Statistics
Descriptive Statistics is an essential part of data analysis that focuses on summarizing and presenting data in a way that is easy to understand. The primary goal is to provide an overview of the available data using various techniques that describe patterns, distributions, and relationships between variables.
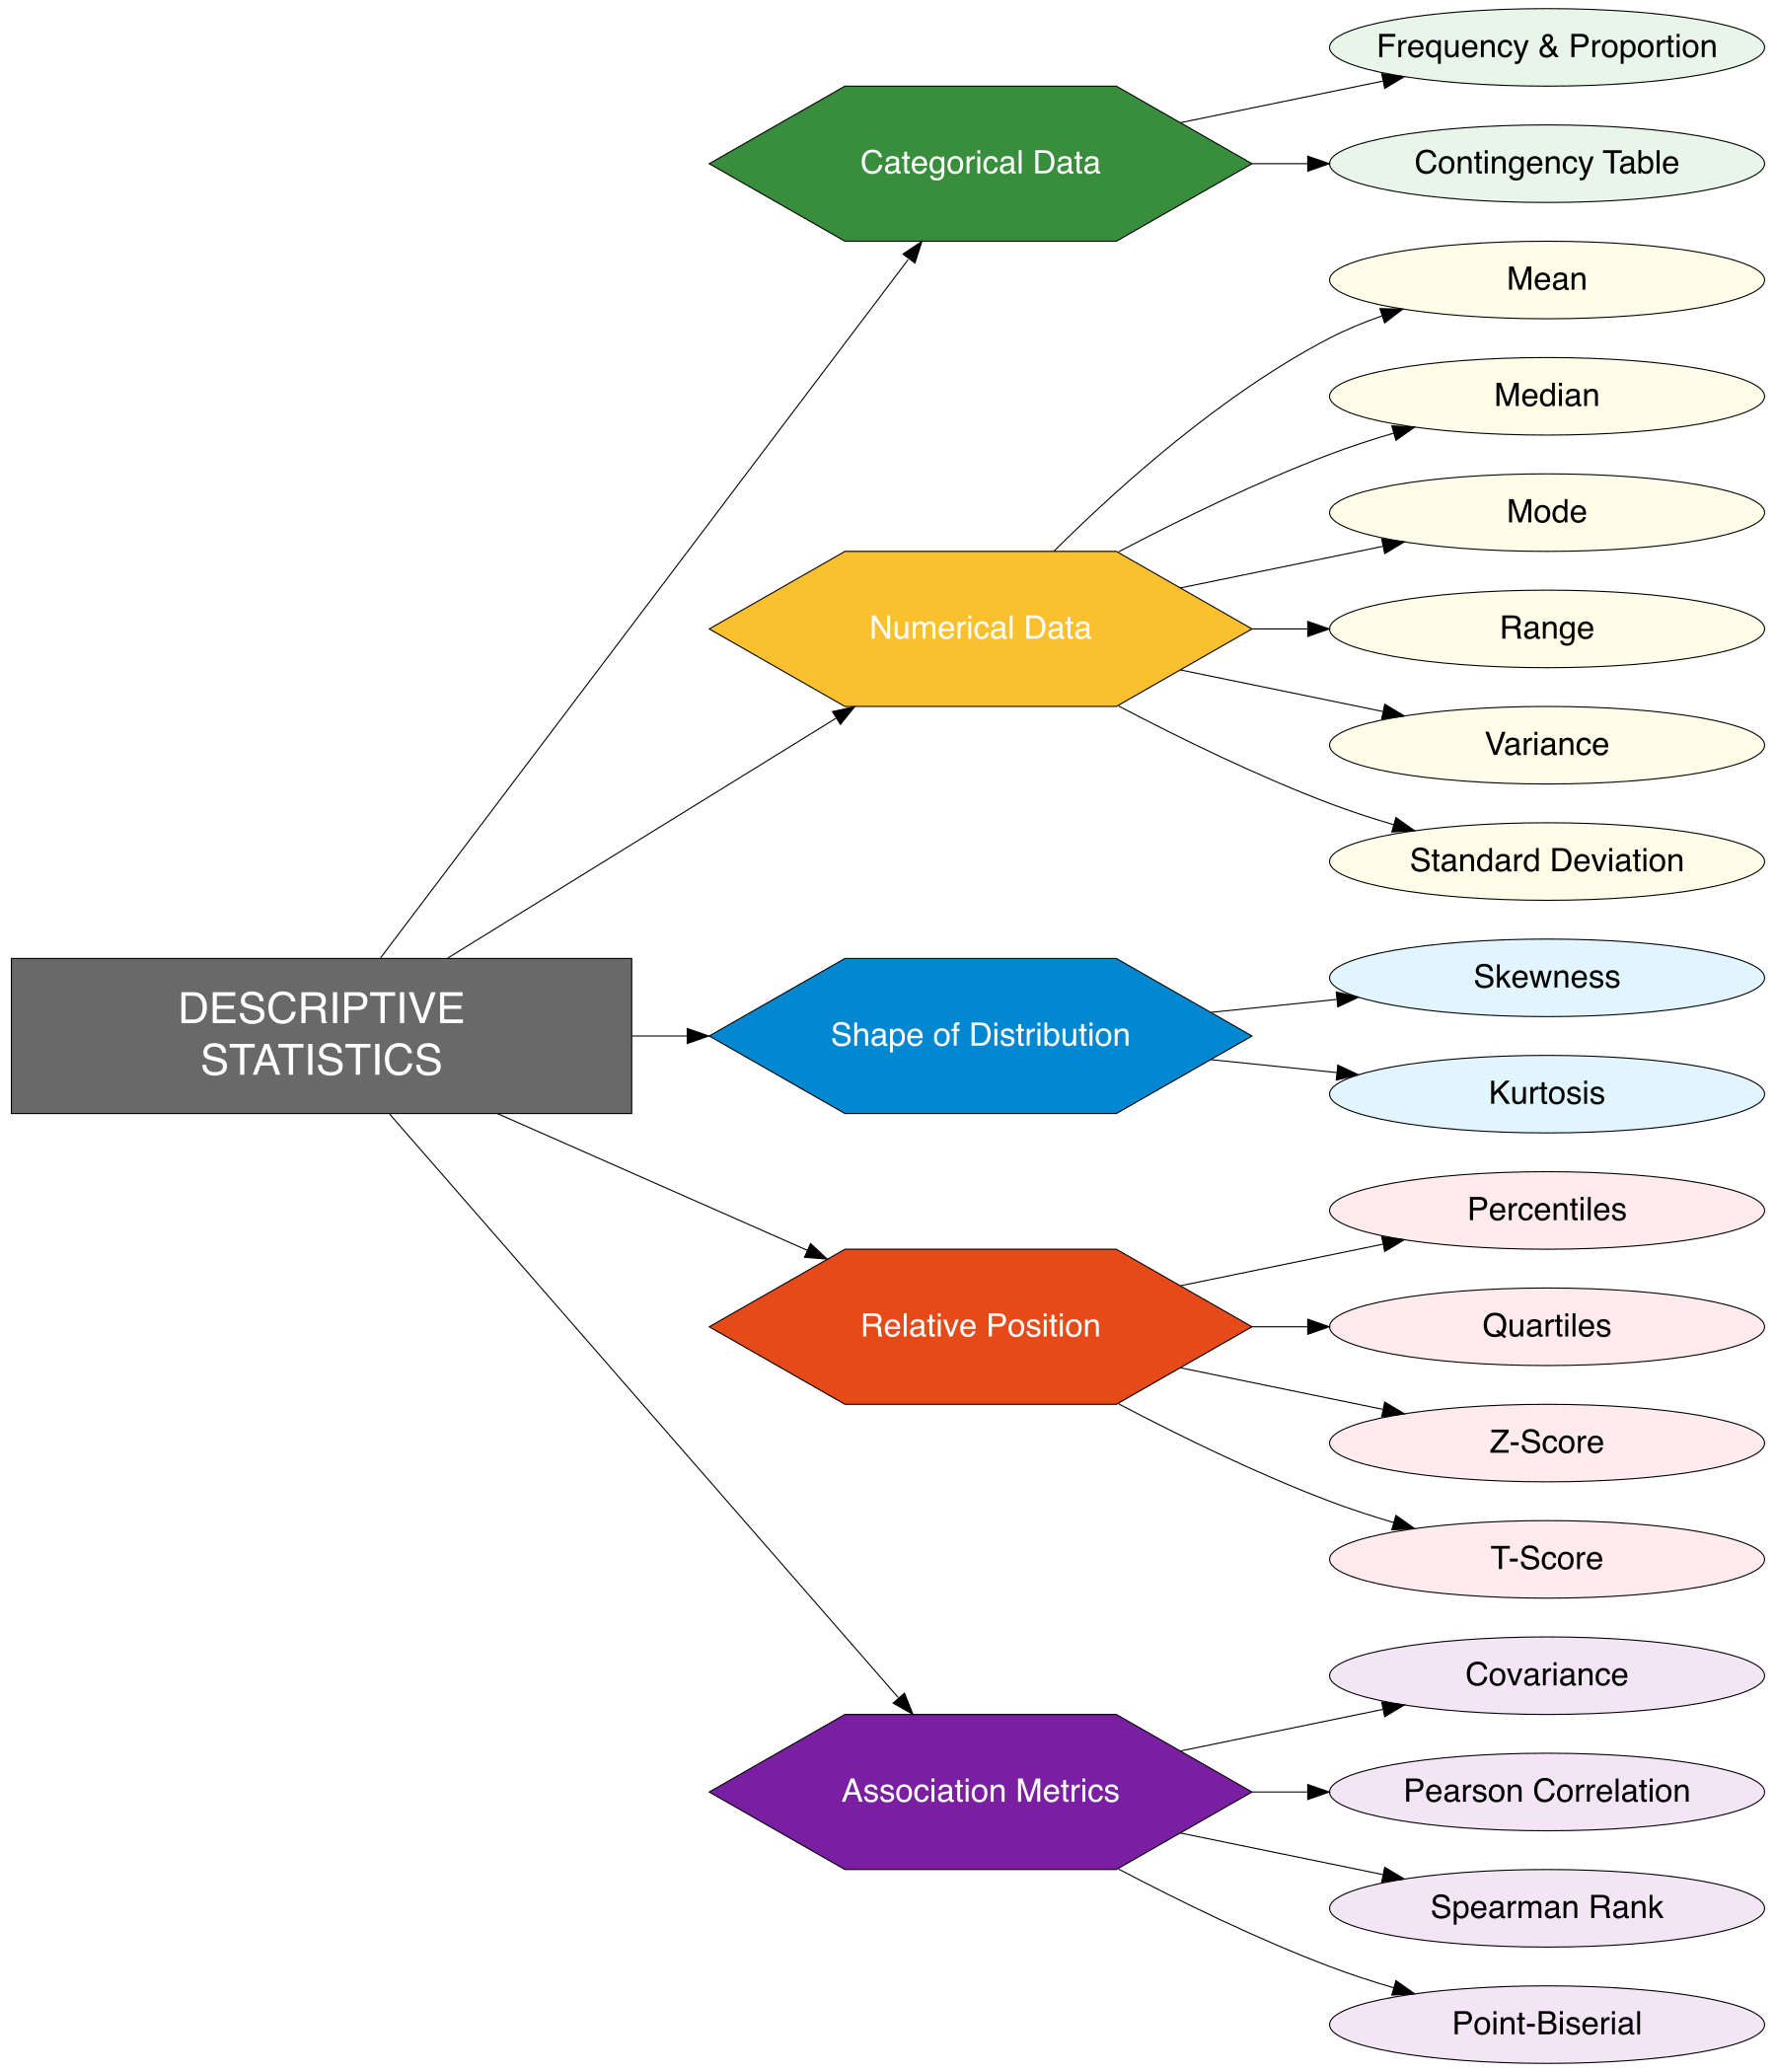
In the following mind map presents a comprehensive visual overview of Descriptive Statistics, covering key aspects of categorical data, numerical data, distribution shape, relative position, and association metrics between variables.
In data analysis, there is often a distinction between categorical and numerical data. Descriptive statistics for categorical data involves calculating frequency and proportion, using contingency tables, and frequency distributions. For numerical data, it focuses on measures like mean, median, mode, range, variance, and standard deviation.
It is crucial to understand the shape of the distribution of data through metrics such as skewness and kurtosis. Additionally, relative position measures like percentiles, quartiles, and z-scores help in understanding how data points are positioned relative to others in the dataset.
Let say you have dataset like this:
7.1 Categorical Data
7.1.1 Frequency and Proportion
- Frequency: The number of times a particular category appears in a categorical variable.
- Proportion: The frequency of a category divided by the total number of observations.
Given a sample of values from the Product_Category variable:
# Identify categorical variables (character or factor)
categorical_vars <- sapply(data_bisnis,
                           function(x) is.character(x) || is.factor(x))
names(data_bisnis)[categorical_vars]
[1] "Transaction_ID" "Customer_ID" "Product_Category" "Product_ID"
[5] "Region" "Sales_Channel" Frequency & Proportion Table
library(dplyr)
library(knitr)

data_bisnis %>%
  count(Product_Category) %>%
  mutate(Proportion = n / sum(n)) %>%
kable()| Product_Category | n | Proportion |
|---|---|---|
| Books | 95 | 0.190 |
| Clothing | 111 | 0.222 |
| Electronics | 88 | 0.176 |
| Groceries | 96 | 0.192 |
| Home | 110 | 0.220 |
Proportion is calculated as:
Proportion = Frequency / Total Observations
Example: Clothing → 3 / 10 = 0.30
7.1.2 Contingency Table
A contingency table (or cross-tabulation) is a table that displays the frequency distribution of two categorical variables simultaneously.
It is useful to identify relationships or dependencies between the variables.
From a sample of 9 rows combining Region and Sales_Channel:
Base R
# Create the contingency table
contingency<- table(data_bisnis$Region, data_bisnis$Sales_Channel)

# Add the "Total" column and "Total" row
contingency_totals <- addmargins(contingency)

# Print the table
kable(contingency_totals)| Offline | Online | Sum | |
|---|---|---|---|
| East | 63 | 63 | 126 |
| North | 76 | 65 | 141 |
| South | 64 | 49 | 113 |
| West | 59 | 61 | 120 |
| Sum | 262 | 238 | 500 |
Tidyverse R
library(tidyr)
library(dplyr)

# Create the contingency table with counts
Contingency <- data_bisnis %>%
  count(Region, Sales_Channel) %>%
  pivot_wider(
    names_from = Sales_Channel,
    values_from = n,
    values_fill = list(n = 0)
  ) %>%
  # Add Total column and Grand Total row using summarise
  mutate(Total = `Online` + `Offline`) %>%
  bind_rows(
    summarise(., Region = "Total",
              Online = sum(.$Online),
              Offline = sum(.$Offline),
              Total = sum(.$Total))
  ) %>%
  add_row(Region = "Grand Total",
          Online = sum(.$Online),
          Offline = sum(.$Offline),
          Total = sum(.$Total))

# Print the contingency table with totals
kable(Contingency)| Region | Offline | Online | Total |
|---|---|---|---|
| East | 63 | 63 | 126 |
| North | 76 | 65 | 141 |
| South | 64 | 49 | 113 |
| West | 59 | 61 | 120 |
| Total | 262 | 238 | 500 |
| Grand Total | 524 | 476 | 1000 |
Interpretation:
- 2 transactions from North used the Online channel.
- 2 transactions from North used the Offline channel.
- Total: 4 transactions from North.
7.2 Numerical Data
In statistics, numerical data refers to data that consists of numbers, which can be used for various types of calculations and analysis. Numerical data is divided into two types: discrete (where the data can only take certain specific values) and continuous (where the data can take any value within a given range). Here, we will discuss key concepts related to numerical data, including the mean, median, mode, range, variance, and standard deviation.
7.2.1 Mean
The mean is the average of a set of numbers. It is calculated by adding all the numbers in the dataset and dividing by the total number of values.
Formula:
\[ \text{Mean} = \frac{\sum X_i}{n} \]
Where:
- \(\sum X_i\) is the sum of all the data points.
- \(n\) is the number of data points.
Example:
Given the dataset: 5, 7, 9, 10, 15
\[ \text{Mean} = \frac{5 + 7 + 9 + 10 + 15}{5} = \frac{46}{5} = 9.2 \]
7.2.2 Median
The median is the middle value in a dataset when the values are arranged in ascending or descending order. If the dataset has an even number of values, the median is the average of the two middle values.
How to Calculate:
- Sort the data in ascending order.
- If the dataset has an odd number of values, the median is the middle value.
- If the dataset has an even number of values, the median is the average of the two middle values.
Example:
Given the dataset: 5, 7, 9, 10, 15 (sorted)
Since there are 5 values (odd number), the median is the middle value: \[ \text{Median} = 9 \]
For an even number of values, e.g., 5, 7, 9, 10, 15, 20: The middle values are 9 and 10, so: \[ \text{Median} = \frac{9 + 10}{2} = 9.5 \]
7.2.3 Mode
The mode is the value that occurs most frequently in a dataset. A dataset may have one mode (unimodal), more than one mode (multimodal), or no mode at all.
How to Calculate:
- Count the frequency of each data point.
- The value with the highest frequency is the mode.
Example:
Given the dataset: 5, 7, 9, 9, 10, 15, 15, 15
The mode is 15, as it appears 3 times, more than any other value.
7.2.4 Range
The range is the difference between the largest and smallest values in a dataset. It provides a measure of how spread out the values are.
How to Calculate:
\[ \text{Range} = \text{Maximum Value} - \text{Minimum Value} \]
Example:
Given the dataset: 5, 7, 9, 10, 15
\[ \text{Range} = 15 - 5 = 10 \]
7.2.5 Variance
Variance is a measure of how much the values in a dataset differ from the mean. It calculates the average squared deviation of each data point from the mean. Variance is important for understanding the spread of data.
Formula:
\[ \text{Variance} = \frac{\sum (X_i - \mu)^2}{n} \]
Where:
- \(X_i\) represents each data point.
- \(\mu\) is the mean of the dataset.
- \(n\) is the number of data points.
7.2.6 Standard Deviation
Standard deviation is the square root of the variance. It measures the amount of variation or dispersion in a dataset.
Formula:
\[ \text{Standard Deviation} = \sqrt{\text{Variance}} = \sqrt{\frac{\sum (X_i - \mu)^2}{n}} \]
Interpretation of Standard Deviation Values:
- Low standard deviation: Data points are close to the mean, indicating less variability.
- High standard deviation: Data points are spread out over a wider range, indicating more variability.
Example:
Given the dataset: 5, 7, 9, 10, 15
Step 1: Calculate the Mean
\[ \text{Mean} = \frac{5 + 7 + 9 + 10 + 15}{5} = \frac{46}{5} = 9.2 \]
Step 2: Variance Formula
The formula for population variance is:
\[ \text{Variance} = \frac{(X_1 - \mu)^2 + (X_2 - \mu)^2 + \dots + (X_n - \mu)^2}{n} \]
For our dataset:
\[ \text{Variance} = \frac{(5 - 9.2)^2 + (7 - 9.2)^2 + (9 - 9.2)^2 + (10 - 9.2)^2 + (15 - 9.2)^2}{5} \]
Step 3: Compute Each Term
- \((5 - 9.2)^2 = (-4.2)^2 = 17.64\)
- \((7 - 9.2)^2 = (-2.2)^2 = 4.84\)
- \((9 - 9.2)^2 = (-0.2)^2 = 0.04\)
- \((10 - 9.2)^2 = (0.8)^2 = 0.64\)
- \((15 - 9.2)^2 = (5.8)^2 = 33.64\)
Step 4: Variance
\[ \text{Variance} = \frac{17.64 + 4.84 + 0.04 + 0.64 + 33.64}{5} = \frac{56.8}{5} = 11.36 \]
Step 5: Standard Deviation
\[ \text{Standard Deviation} = \sqrt{11.36} \approx 3.37 \]
The variance is 11.36, indicating the average squared deviation from the mean. Standard deviation is more interpretable than variance because it is in the same unit as the data, while variance is in squared units. It helps understand the extent to which individual data points deviate from the mean.
7.2.7 Summary
We will compute the following statistical measures:
- Mean is sensitive to outliers but easy to calculate.
- Median is robust to skewed distributions and outliers.
- Mode represents the most frequent value and may not always exist or be unique.
- Range is the simplest measure of spread but does not provide information about the distribution.
- Variance measures the spread of data, while standard deviation provides a more interpretable measure of data variability.
Single Numerical Variable
In data analysis, a single numerical variable (also known as univariate numerical data) provides essential information about the central tendency and dispersion of values. This section covers the analysis of one such variable from our dataset: Total_Price.
# Load library
library(dplyr)
library(knitr)

# Data numerik: Total_Price dari data_bisnis
data_numeric <- data_bisnis$Total_Price

# Hitung statistik
mean_val <- mean(data_numeric)
median_val <- median(data_numeric)
mode_val <- as.numeric(names(sort(table(data_numeric), decreasing = TRUE)[1]))
range_val <- max(data_numeric) - min(data_numeric)
variance_val <- var(data_numeric)*(length(data_numeric)-1)/length(data_numeric)
sd_val <- sqrt(variance_val)

# Buat tabel
summary_stats <- data.frame(
  Measure = c("Mean", "Median", "Mode", "Range",
              "Variance", "Standard Deviation"),
  Value = round(c(mean_val, median_val, mode_val,
                  range_val, variance_val, sd_val), 2)
)

# Tampilkan tabel
kable(summary_stats, caption="Summary Statistics for Total_Price (Population)")| Measure | Value |
|---|---|
| Mean | 36.66 |
| Median | 30.55 |
| Mode | 0.00 |
| Range | 177.06 |
| Variance | 764.34 |
| Standard Deviation | 27.65 |
7.2.7.1 Multi Numerical Variables
Each of these measures plays an important role in summarizing and analyzing numerical data, and they should be chosen based on the nature of the data and the type of analysis being conducted.
library(dplyr)
library(knitr)

# Compute summary statistics in long format
summary_table_df <- data_bisnis %>%
  summarise(across(where(is.numeric),
                   list(mean = mean,
                        median = median,
                        min = min,
                        max = max,
                        variance = var),
                   .names = "{.fn}_{.col}")) %>%
  pivot_longer(cols = everything(),
               names_to = c("stat", "variable"),
               names_sep = "_",
               values_to = "value") %>%
  pivot_wider(names_from = variable, values_from = value)

# Display the table
kable(summary_table_df, caption = "Summary Statistics of Numeric Variables")| stat | Quantity | Unit | Discount | Delivery | Total |
|---|---|---|---|---|---|
| mean | 3.140000 | 13.68072 | 0.1428800 | 5.330000 | 36.66416 |
| median | 3.000000 | 13.30000 | 0.1500000 | 5.000000 | 30.54500 |
| min | 0.000000 | -1.27000 | 0.0000000 | 1.000000 | -2.37000 |
| max | 9.000000 | 30.83000 | 0.3000000 | 10.000000 | 174.69000 |
| variance | 3.078557 | 32.65094 | 0.0074578 | 8.870842 | 765.87086 |
7.3 Shape of Distribution
Skewness and kurtosis are statistical measures that help us understand the shape of a distribution. Both are essential for risk analysis, outlier detection, and deeper interpretation of business data distributions.
Example Data (10 Prices from data_bisnis$price)
price <- c(80, 90, 100, 110, 120, 130, 140, 150, 160, 200)7.3.1 Mean and Standard Deviation
- Mean \(\bar{x}\):
\[ \bar{x} = \frac{80 + 90 + \dots + 200}{10} = 128 \]
- Standard Deviation \(s\):
\[ s = \sqrt{\frac{1}{n - 1} \sum (x_i - \bar{x})^2} = \sqrt{\frac{11756}{9}} \approx 36.1 \]
7.3.2 Skewness
\[ \text{Skewness} = \frac{1}{n} \sum \left( \frac{x_i - \bar{x}}{s} \right)^3 \]
| Price | Standardized (\(z\)) | \(z^3\) |
|---|---|---|
| 80 | -1.33 | -2.35 |
| 90 | -1.05 | -1.15 |
| 100 | -0.78 | -0.47 |
| 110 | -0.50 | -0.13 |
| 120 | -0.22 | -0.01 |
| 130 | 0.06 | 0.00 |
| 140 | 0.33 | 0.04 |
| 150 | 0.61 | 0.23 |
| 160 | 0.89 | 0.71 |
| 200 | 1.99 | 7.88 |
| Total | — | 4.75 |
\[ \text{Skewness} = \frac{4.75}{10} = 0.475 \]
Interpretation: Slight positive skew → right tail longer.
7.3.3 Kurtosis
\[ \text{Kurtosis} = \frac{1}{n} \sum \left( \frac{x_i - \bar{x}}{s} \right)^4 \]
| Price | Standardized (\(z\)) | \(z^4\) |
|---|---|---|
| 80 | -1.33 | 3.13 |
| 90 | -1.05 | 1.22 |
| 100 | -0.78 | 0.37 |
| 110 | -0.50 | 0.06 |
| 120 | -0.22 | 0.002 |
| 130 | 0.06 | 0.0001 |
| 140 | 0.33 | 0.012 |
| 150 | 0.61 | 0.14 |
| 160 | 0.89 | 0.63 |
| 200 | 1.99 | 15.80 |
| Total | — | 21.37 |
\[ \text{Kurtosis} = \frac{21.37}{10} = 2.14 \]
Interpretation: Platykurtic (flatter than normal distribution, fewer extreme values).
| Concept | Definition | Usage…Application | Example |
|---|---|---|---|
| Skewness | Measure of asymmetry in the distribution. Formula: Skewness = E[(X - μ)^3] / σ^3 | Understand data symmetry and detect bias in distribution. | Skewness of price data = NaN |
| Positive Skew | Tail on the right is longer; most data on the left. Mean > Median. | Common in income, sales data. Indicates presence of high values. | Example: Sales with a few very high prices. |
| Negative Skew | Tail on the left is longer; most data on the right. Mean < Median. | May indicate minimum/low value dominance. Useful for returns loss modeling. | Example: Return loss data with rare but large negative values. |
| Zero Skew | Symmetric distribution. Mean ≈ Median. | Ideal for standard modeling assumptions (e.g., regression). | Example: Normally distributed cost data. |
| Kurtosis | Measure of the ‘tailedness’ of the distribution. Formula: Kurtosis = E[(X - μ)^4] / σ^4 | Detect outliers and model tail risk in financial/business data. | Kurtosis of price data = NaN |
| Leptokurtic | Heavy tails and sharp peak. High outlier risk. | High risk of extreme values. Needs robust modeling. | Example: Stock prices with frequent extreme changes. |
| Platykurtic | Light tails and flat peak. Less extreme values. | Low risk. Less concern about outliers. | Example: Customer purchase frequency data (low variation). |
| Mesokurtic | Normal tails and peak. Follows normal distribution (kurtosis ≈ 3). | Expected in many natural distributions (e.g., height, IQ). | Example: Simulated price data with normal distribution. |
7.4 Relative Position
Relative position refers to how a specific data point compares to other data points in a dataset. It is often used to understand the distribution and spread of the data. By calculating relative positions, we can gain insights into how an individual observation fits within the entire data set. This is particularly useful when measuring performance, identifying outliers, and comparing data points across different distributions. Key metrics like percentiles, quartiles, Z-scores, and T-scores are commonly used to analyze and interpret relative position.
Below is an overview of these concepts:
| Concept | Definition | Usage…Application | Example |
|---|---|---|---|
| Percentiles | Indicates the value below which a given percentage of observations fall. Percentile = (Rank / Total Observations) × 100 | Used to evaluate performance levels (e.g., top 10%), set cut-off thresholds, and benchmarking. | In a test with 100 products, the 90th percentile corresponds to the score above which only 10% of the students scored higher. |
| Quartiles | Q1 = 25th percentile, Q2 = 50th (Median), Q3 = 75th percentile. | Used in boxplots, IQR (Q3 - Q1) calculation, and outlier detection. | In a dataset of the prices: Q1 = 50, Q2 (median) = 70, Q3 = 85, IQR = 35 (Q3-Q1). |
| Z-Score | Standardized score: Z = (X - μ) / σ | Measures how many standard deviations a value is from the mean. Enables comparison across distributions. | For price = 100 , Z-score = NA (Standard deviations from the mean). |
| T-Score | Similar to Z-score but adjusted for small samples: T = (X - x̄) / (s / √n) | Used in hypothesis testing and small-sample inference. Preferred when population σ is unknown. | For price = 100 , T-score = NA (Adjusted for small sample size). |
7.5 Association Metrics
In data analysis, understanding the relationships between variables is essential for drawing insights from data. Association metrics, such as covariance and correlation coefficients, are used to measure the strength and direction of relationships between variables. Below is a table summarizing the key association metrics:
| Concept | Definition | Usage...Application | Example |
|---|---|---|---|
| Covariance | Measures the direction of the linear relationship between two variables. Positive covariance indicates both increase together, negative indicates inverse. | Used to determine the direction of the relationship between two variables but limited in scale comparison. Formula: Cov(X, Y) = (1 / (n - 1)) * Σ[(Xᵢ - X̄)(Yᵢ - Ŷ)] |
cov(data_bisnis$price, data_bisnis$quantity) to determine how price and quantity vary together. |
| Pearson Correlation Coefficient | Measures the strength and direction of the linear relationship between two variables. | Used when data is continuous and normally distributed. Formula: r = Cov(X, Y) / (σₓ * σᵧ) |
cor(data_bisnis$price, data_bisnis$quantity, method = 'pearson') to find the linear relationship between price and quantity. |
| Spearman’s Rank Correlation | Non-parametric measure of the strength and direction of a monotonic relationship between two variables. | Used for ordinal data or when variables do not have a linear relationship. Formula: ρ = 1 - (6 * Σ(dᵢ²)) / (n(n² - 1)) |
cor(data_bisnis$price, data_bisnis$quantity, method = 'spearman') to find the monotonic relationship between price and quantity. |
| Point-Biserial Correlation | Measures the relationship between one continuous variable and one binary variable. | Commonly used in psychological and social sciences. Formula: rₚ = (M₁ - M₂) / σ * √(n₁ * n₂ / (n(n - 1))) |
cor(data_bisnis$price, is_discount, method = 'pearson') to find the correlation between price and discount status. |