In this chapter you’ll learn how you can combine reactiveValues() and observe()/observeEvent() to connect the right hand side of the reactive graph back to the left hand side. These techniques are powerful because they give you manual control over parts of the graph. But they’re also dangerous because they allow your app to do unnecessary work. Most importantly, you can now create infinite loops where your app gets stuck in a cycle of updates that never ends.
16.2 What doesn’t the reactive graph capture?
In Section Section 14.3.12 we discussed what happens when the user causes an input to be invalidated. There are two other important cases where you as the app author might invalidate an input:
You call an update function setting the value argument. This sends a message to the browser to change the value of an input, which then notifies R that the input value has been changed.
You modify the value of a reactive value (created with reactiveVal() or reactiveValues()).
It’s important to understand that in both of these cases a reactive dependency is not created between the reactive value and the observer. While these actions cause the graph to invalidate, they are not recorded through new connections.
To make this idea concrete, take the following simple app, with reactive graph shown in Figure 16.1.
R Code 16.1 : Connection between unnamed observer and the nm input is not recorded
Listing / Output 16.1: The connection between unnamed observer and the nm input is with update function (and reactive values) not recorded. These dependencies are outside of scope.
Picture 16.1: The reactive graph does not record the connections when update functions or reactive values invalidate inputs. Therefore there is no connection between the unnamed observer and the nm input; this dependency is outside of Shiny’s scope.
Procedure 16.1 : What happens when you press the clear button in Listing / Output 16.1?
The browser changes the value of nm (21-23; 24 idle) [book: step 3]
input$clr invalidates, which then invalidates the observer (steps 25-27). [book: step 1]
The observer recomputes, recreating the dependency on input$clr, and telling the browser to change the value of the input control (steps 28-33, idle 34). [book: step 2]
None of these actions change the reactive graph, so it remains as in Picture 16.1 and the graph does not capture the connection from the observer to input$nm.
Note 16.1: {reactlog} steps and sequences
As a debugging aid, the {reactlog} package can capture and draw these connection when you modify reactive values from an observer, but this information is not used by Shiny. You can see that connection with the unnamed observer as a parallel line below the input nm., but there is no connection between unnamed observer and input nm.
When you run Listing / Output 16.1, input a name, pressing the clear button and then invoking {reactlog} with CMD-F3 you can follow the procedure in Procedure 16.1. I have added the step numbers to the five mentioned actions. It turned out that there is in relation to the book a slightly change and different starting point in the order of the steps. If have put the book sequence in square brackets.
16.3 Case studies
Next, lets take a look at a few useful cases where you might combine reactiveValues() and observeEvent() or observe() to solve problems that are otherwise very challenging (if not impossible). These are useful templates for your own apps.
16.3.1 One output modified by multiple inputs
To get started we’ll tackle a very simple problem: @ a common text box that’s updated by multiple events.
R Code 16.2 : One text output modified by multiple inputs
Listing / Output 16.2: One text output modified by multiple inputs
Things get slightly more complicated in the next example, where we have an app with two buttons that let you increase and decrease values. We use reactiveValues() to store the current value, and then observeEvent() to increment and decrement the value when the appropriate button is pushed. The main additional complexity here is that the new value of r$n depends on the previous value.
R Code 16.3 : Values increasing / decreasing by multiple inputs
Picture 16.2 shows the reactive graph for this example. Again note that the reactive graph does not include any connection from the observers back to the reactive value n.
Picture 16.2: The reactive graph does not capture connections from observers (and reactive values) to input values
16.3.2 Accumulating inputs
It’s a similar pattern if you want to accumulate data in order to support data entry. Here the main difference is that we use updateTextInput() to reset the text box after the user clicks the add button.
R Code 16.4 : Accumulate text data with reset
Listing / Output 16.4: Accumulate text data with reset
Another common use case is to provide a start and stop button that lets you control some recurring event. This example uses a running reactive value to control whether or not the number increments, and invalidateLater() to ensure that the observer is invalidated every 250 ms when running.
Notice in this case we can’t easily use observeEvent() because we perform different actions depending on whether running() is TRUE or FALSE. Since we can’t use observeEvent(), we must use isolate() — if we don’t this observer would also take a reactive dependency on n, which it updates, so it would get stuck in an infinite loop.
Hopefully these examples start to give you a flavor of what programming with reactiveValues() and observe() feels like. It’s very imperative: when this happens, do that; when that happens, do the other thing. This makes it easier to understand on a small scale, but harder to understand when bigger pieces start interacting. So generally, you’ll want to use this as sparingly as possible, and keep it isolated so that the smallest possible number of observers modify the reactive value.
16.3.4 Exercises
16.3.4.1 Two histograms with two actionButtons
16.3.4.2 Two histograms with an actionButton and s selectInputs
16.3.4.3 Two histograms with only using reactive()
16.4 Anti-pattern
Once you get the hang of this pattern it’s easy to fall into bad habits:
R Code 16.7 : Reactive value and observer
Listing / Output 16.7: Bad habit: Using reactive values and observers instead of reactive()
If the table or plot are in tabs that are not currently visible, the observer will still draw/plot them.
If the head() functions throws an error, the observe() will terminate the app, but reactive() will propagate it so it’s displayed.
And things will get progressively worse as the app gets more complicated. It’s very easy to revert to the event-driven programming situation described in Section 13.2.3. You end up doing a lot of hard work to analyse the flow of events in your app, rather than relying on Shiny to handle it for you automatically.
It’s informative to compare the two reactive graphs.
Picture 16.3 shows the graph from the first example. It’s misleading because it doesn’t look like nrows is connected to df(). Using a reactive, as in Picture 16.4, makes the precise connection easy to see. Having a reactive graph that is as simple as possible is important for both humans and for Shiny. A simple graph is easier for humans to understand, and a simple graph is easier for Shiny to optimize.
# Escaping the graph {#sec-chap16}```{r}#| label: setup#| results: hold#| include: falsebase::source(file ="R/helper.R")library(glossary)glossary::glossary_path("../glossary-pb/glossary.yml")```## Table of content for chapter 16 {.unnumbered}::::: {#obj-chap16}:::: {.my-objectives}::: {.my-objectives-header}Chapter section list:::::: {.my-objectives-container}::::::::::::## IntroductionIn this chapter you’ll learn how you can combine `reactiveValues()` and `observe()`/`observeEvent()` to connect the right hand side of the reactive graph back to the left hand side. These techniques are powerful because they give you manual control over parts of the graph. But they’re also dangerous because they allow your app to do unnecessary work. Most importantly, you can now create infinite loops where your app gets stuck in a cycle of updates that never ends.## What doesn’t the reactive graph capture?In Section @sec-14-input-changes we discussed what happens when the user causes an input to be invalidated. There are two other important cases where you as the app author might invalidate an input:- You call an update function setting the value argument. This sends a message to the browser to change the value of an input, which then notifies R that the input value has been changed.- You modify the value of a reactive value (created with `reactiveVal()` or `reactiveValues()`).It’s important to understand that in both of these cases a reactive dependency is *not* created between the reactive value and the observer. While these actions cause the graph to invalidate, they are not recorded through new connections.To make this idea concrete, take the following simple app, with reactive graph shown in Figure 16.1.:::::{.my-r-code}:::{.my-r-code-header}:::::: {#cnj-16-unnamed-observer}: Connection between unnamed observer and the `nm` input is not recorded:::::::::::::{.my-r-code-container}::: {#lst-16-unnamed-observer}```{shinylive-r}#| standalone: true#| viewerHeight: 450#| components: [editor, viewer]## file: app.R{{< include apps_16/01-unnamed-observer/app.R>}}```The connection between unnamed observer and the `nm` input is with update function (and reactive values) not recorded. These dependencies are outside of scope.::::::::::::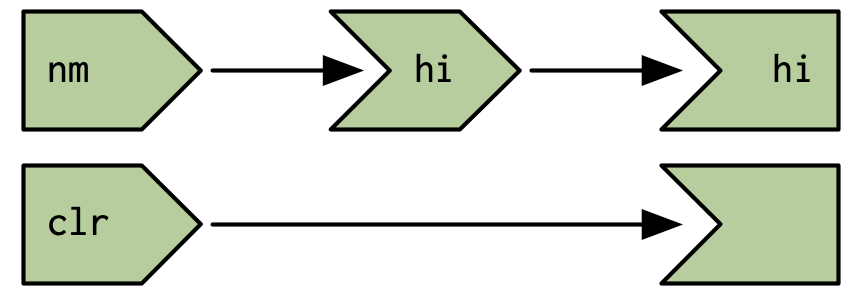{#fig-16-unnamed-observer fig-alt="The input 'nm' is connected with the reactive 'hi' which in turn is connected with the output 'hi'. In another line below the input 'clr' is connected with an unnamed observer." fig-align="center" width="70%"}:::::{.my-procedure}:::{.my-procedure-header}:::::: {#prp-16-unnamed-observer}: What happens when you press the clear button in @lst-16-unnamed-observer?:::::::::::::{.my-procedure-container}1. `input$nm` invalidates, `invalidating hi()` then `output$hi` (steps 13-15 invalidating; 16-17 removing dependencies) [book: step 4]5. `output$hi` recomputes, forcing `hi()` to recompute (steps 18-20) [book: step 5]3. The browser changes the value of `nm` (21-23; 24 idle) [book: step 3]1. `input$clr` invalidates, which then invalidates the observer (steps 25-27). [book: step 1]2. The observer recomputes, recreating the dependency on `input$clr`, and telling the browser to change the value of the input control (steps 28-33, idle 34). [book: step 2]:::::::::None of these actions change the reactive graph, so it remains as in @fig-16-unnamed-observer and the graph does not capture the connection from the observer to `input$nm`.::: {.callout-note #nte-16-unnamed-observer}###### {reactlog} steps and sequencesAs a debugging aid, the {**reactlog**} package can capture and draw these connection when you modify reactive values from an observer, but this information is not used by Shiny. You can see that connection with the unnamed observer as a parallel line below the input `nm`., but there is no connection between unnamed observer and input `nm`.When you run @lst-16-unnamed-observer, input a name, pressing the clear button and then invoking {**reactlog**} with `CMD-F3` you can follow the procedure in @prp-16-unnamed-observer. I have added the step numbers to the five mentioned actions. It turned out that there is in relation to the book a slightly change and different starting point in the order of the steps. If have put the book sequence in square brackets.:::## Case studiesNext, lets take a look at a few useful cases where you might combine `reactiveValues()` and `observeEvent()` or `observe()` to solve problems that are otherwise very challenging (if not impossible). These are useful templates for your own apps.### One output modified by multiple inputsTo get started we’ll tackle a very simple problem: @ a common text box that’s updated by multiple events.:::{.column-body-outset}:::::{.my-r-code}:::{.my-r-code-header}:::::: {#cnj-16-multiple-inputs1}: One text output modified by multiple inputs:::::::::::::{.my-r-code-container}::: {#lst-16-multiple-inputs1}```{shinylive-r}#| standalone: true#| viewerHeight: 500#| components: [editor, viewer]## file: app.R{{< include apps_16/02-multiple-inputs1/app.R>}}```One text output modified by multiple inputs:::::::::::::::Things get slightly more complicated in the next example, where we have an app with two buttons that let you increase and decrease values. We use `reactiveValues()` to store the current value, and then `observeEvent()` to increment and decrement the value when the appropriate button is pushed. The main additional complexity here is that the new value of `r$n` depends on the previous value.:::{.column-body-outset}:::::{.my-r-code}:::{.my-r-code-header}:::::: {#cnj-16-multiple-inputs2}: Values increasing / decreasing by multiple inputs:::::::::::::{.my-r-code-container}::: {#lst-16-multiple-inputs2}```{shinylive-r}#| standalone: true#| viewerHeight: 500#| components: [editor, viewer]## file: app.R{{< include apps_16/02-multiple-inputs2/app.R>}}```Values increasing / decreasing by multiple inputs:::::::::::::::@fig-16-increasing-decreasing shows the reactive graph for this example. Again note that the reactive graph does not include any connection from the observers back to the reactive value `n`.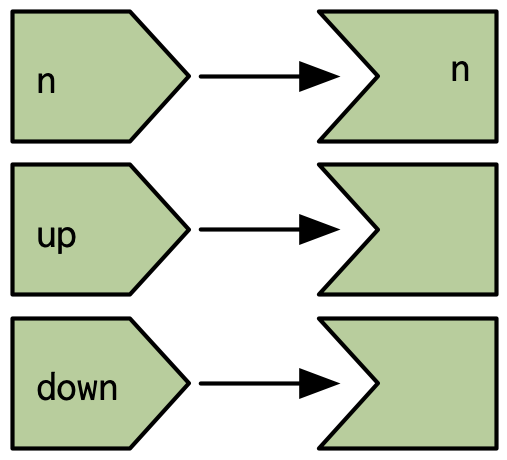{#fig-16-increasing-decreasing fig-alt="alt-text" fig-align="center" width="40%"}### Accumulating inputsIt’s a similar pattern if you want to accumulate data in order to support data entry. Here the main difference is that we use `updateTextInput()` to reset the text box after the user clicks the add button.:::{.column-body-outset}:::::{.my-r-code}:::{.my-r-code-header}:::::: {#cnj-16-accumulating-inputs1}: Accumulate text data with reset:::::::::::::{.my-r-code-container}::: {#lst-16-accumulating-inputs1}```{shinylive-r}#| standalone: true#| viewerHeight: 500#| components: [editor, viewer]## file: app.R{{< include apps_16/03-accumulating-inputs1/app.R>}}```Accumulate text data with reset:::::::::::::::We could make this slightly more useful by providing a delete button and making sure that the add button doesn’t create duplicate names::::{.column-body-outset}:::::{.my-r-code}:::{.my-r-code-header}:::::: {#cnj-16-accumulating-inputs2}: Accumulate text data with delete, reset and preventing duplicates:::::::::::::{.my-r-code-container}::: {#lst-16-accumulating-inputs1}```{shinylive-r}#| standalone: true#| viewerHeight: 550#| components: [editor, viewer]## file: app.R{{< include apps_16/03-accumulating-inputs2/app.R>}}```Accumulate text data with delete, reset and preventing duplicates:::::::::::::::### Pausing animations {#sec-16-pausing-animations}Another common use case is to provide a start and stop button that lets you control some recurring event. This example uses a running reactive value to control whether or not the number increments, and `invalidateLater()` to ensure that the observer is invalidated every 250 ms when running.:::{.column-body-outset}:::::{.my-r-code}:::{.my-r-code-header}:::::: {#cnj-16-pausing-animations}: Pausing animations:::::::::::::{.my-r-code-container}::: {#lst-16-pasuing-animation}```{shinylive-r}#| standalone: true#| viewerHeight: 600#| components: [editor, viewer]## file: app.R{{< include apps_16/04-pausing-animations/app.R>}}```Pausing animations:::::::::::::::::: {.callout-note #nte-16-pausing-animations}###### Compare with my solution to stop `shinylive-r` My solution to stop `shinylive-r` is very similar. See @lst-15-ex-reactive-never-executed2 and @cau-stop-app-not-working-with-shinylive-r.:::Notice in this case we can’t easily use `observeEvent()` because we perform different actions depending on whether `running()` is `TRUE` or `FALSE`. Since we can’t use `observeEvent()`, we must use `isolate()` — if we don’t this observer would also take a reactive dependency on `n`, which it updates, so it would get stuck in an infinite loop.Hopefully these examples start to give you a flavor of what programming with `reactiveValues()` and `observe()` feels like. It’s very imperative: when this happens, do that; when that happens, do the other thing. This makes it easier to understand on a small scale, but harder to understand when bigger pieces start interacting. So generally, you’ll want to use this as sparingly as possible, and keep it isolated so that the smallest possible number of observers modify the reactive value.### Exercises {#sec-16-exercises}#### Two histograms with two actionButtons #### Two histograms with an actionButton and s selectInputs#### Two histograms with only using `reactive()`## Anti-patternOnce you get the hang of this pattern it’s easy to fall into bad habits::::{.column-page-inset}:::::{.my-r-code}:::{.my-r-code-header}:::::: {#cnj-16-anti-pattern1}: Reactive value and observer:::::::::::::{.my-r-code-container}::: {#lst-16-anti-pattern1}```{shinylive-r}#| standalone: true#| viewerHeight: 550#| components: [editor, viewer]## file: app.R{{< include apps_16/05-anti-pattern1/app.R>}}```Bad habit: Using reactive values and observers instead of `reactive()`:::::::::::::::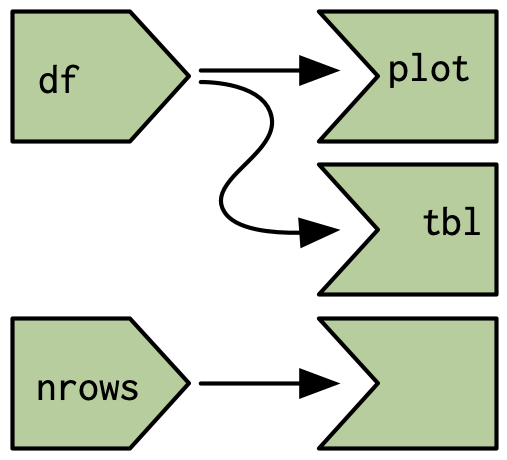{#fig-16-anti-pattern1 fig-alt="alt-text" fig-align="center" width="50%"}In this simple case, this code doesn’t do much extra work compared to the alternative that uses `reactive()`::::{.column-page-inset}:::::{.my-r-code}:::{.my-r-code-header}:::::: {#cnj-16-anti-pattern2}: `reactive()` instead of reactive value and observer:::::::::::::{.my-r-code-container}::: {#lst-16-anti-pattern2}```{shinylive-r}#| standalone: true#| viewerHeight: 550#| components: [editor, viewer]## file: app.R{{< include apps_16/05-anti-pattern2/app.R>}}```The same functionality as @lst-16-anti-pattern1 but using just `reactive()`:::::::::::::::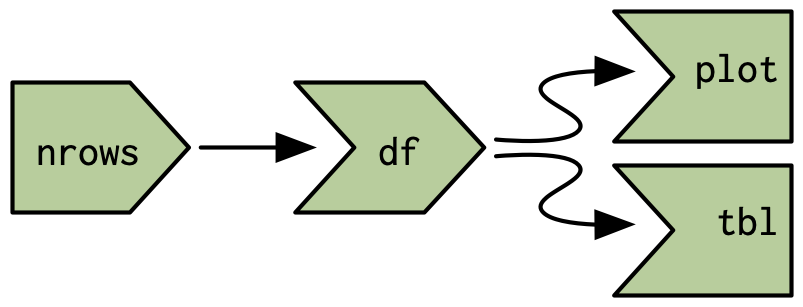{#fig-16-anti-pattern2 fig-alt="alt-text" fig-align="center" width="70%"}@lst-16-anti-pattern1 is not only more complex, but has other drawbacks too:- If the table or plot are in tabs that are not currently visible, the observer will still draw/plot them.- If the `head()` functions throws an error, the `observe()` will terminate the app, but `reactive()` will propagate it so it’s displayed.And things will get progressively worse as the app gets more complicated. It’s very easy to revert to the event-driven programming situation described in @sec-13-event-driven-programming. You end up doing a lot of hard work to analyse the flow of events in your app, rather than relying on Shiny to handle it for you automatically.It’s informative to compare the two reactive graphs. @fig-16-anti-pattern1 shows the graph from the first example. It’s misleading because it doesn’t look like `nrows` is connected to `df()`. Using a reactive, as in @fig-16-anti-pattern2, makes the precise connection easy to see. Having a reactive graph that is as simple as possible is important for both humans and for Shiny. A simple graph is easier for humans to understand, and a simple graph is easier for Shiny to optimize.## Session Info {.unnumbered}::: my-r-code::: my-r-code-headerSession Info:::::: my-r-code-container```{r}#| label: session-infosessioninfo::session_info()```::::::


