5.2 Open Water Navigation in tidal waters
5.2.1 Chartwork
Although it’s possible to do everything you need to on a chart with a hiking compass and a folding ruler, it’s much easier to have a few simple instruments and know how to use them.
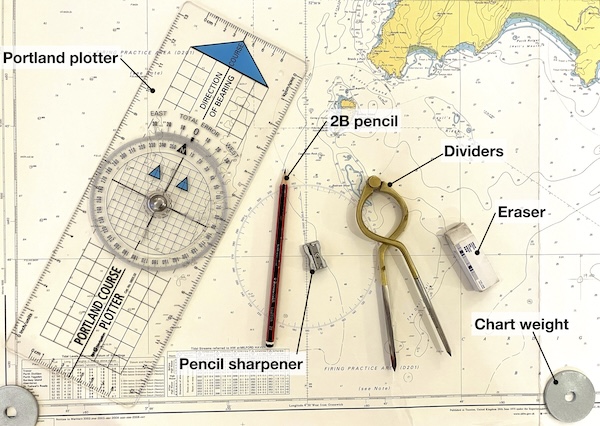
2B pencil: a soft pencil is preferred for chart work as it’s easier to erase once you’re done (or in the unlikely event that you make a mistake!).

Pencil sharpener: to keep your pencil nice and sharp
Eraser: to deal with any mistakes and remove the lines from the chart once your planning is complete so the chart is ready for the next time
Chart weight: Given the size of many charts, they tend to get stored rolled up, so it’s helpful to have something to weigh them down while you work on them. You can, of course, buy beautiful brass chart weights at great expense for this purpose. Large washers (e.g. M10 penny washers) cost almost nothing and work equally well.
Plotters: The ‘Portland’ or ‘Breton’ plotter is basically a big hiking compass without the magnetic needle. It can be used to measure bearings and draw lines at define angles. It’s big enough to be useful as a straight edge too.
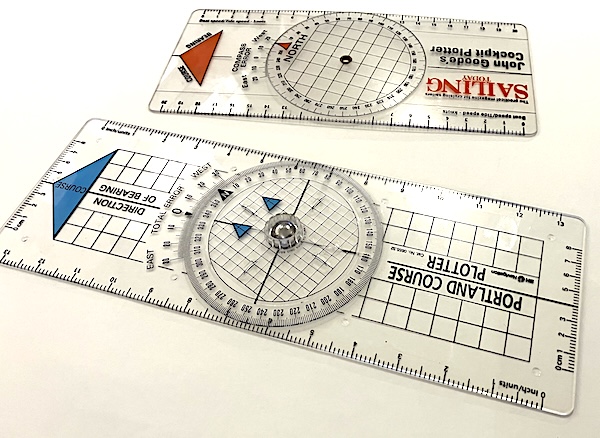
The Portland Plotter shown (below, blue parts) in the image below is rigid, easy to use and my preferred option for chartwork. You can buy these from many Chandlers and the RYA. The other plotter (above, red parts) is smaller, very thin and flexes. It’s much less nice to use, but easier to keep with pilots, books etc in you navigation ‘kit’ if you only intend to use it occasionally.
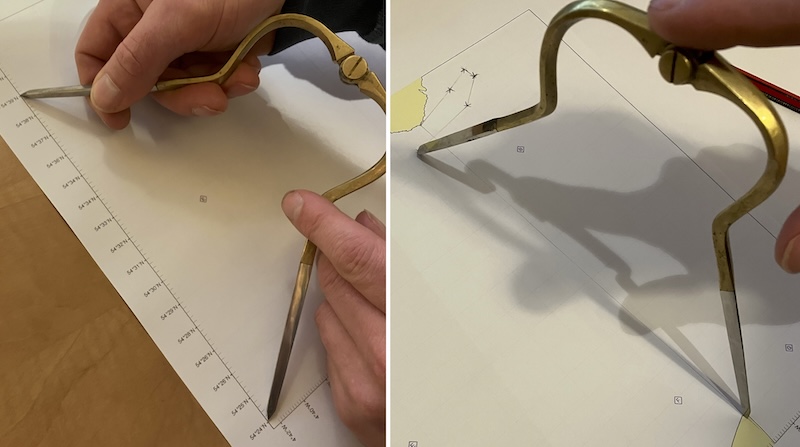
Dividers: Whilst a pair of drawing compasses will work, there’s nothing like a pair of brass dividers to bring a bit of mystique to your chart work. The shape of these dividers is intended to enable one-handed use.
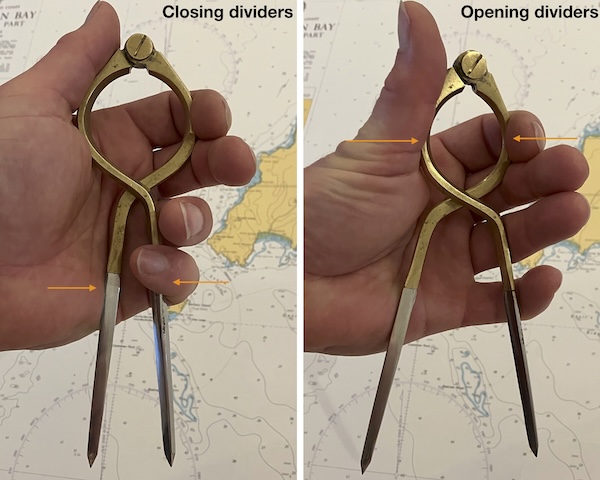
The dividers can be closed (i.e. made to measure less distance) by squeezing their legs together, as you might expect. The dividers can be opened (i.e. made to measure more distance) by squeezing the top part. This means that you can set the dividers with one hand. Notice that I’m using my left hand here as I prefer to hold my pencil in the right hand.
If longer distances need to be be measured, the dividers can be opened in the opposite direction:
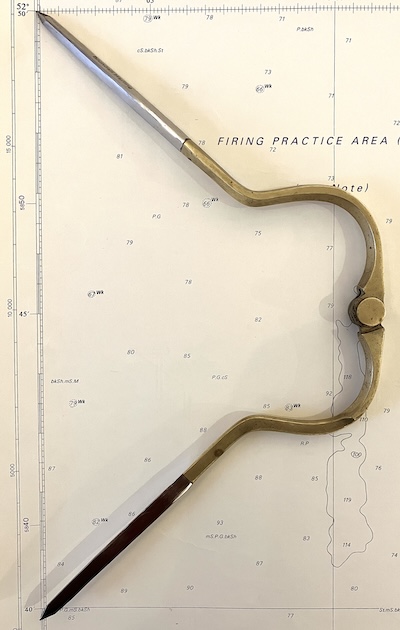
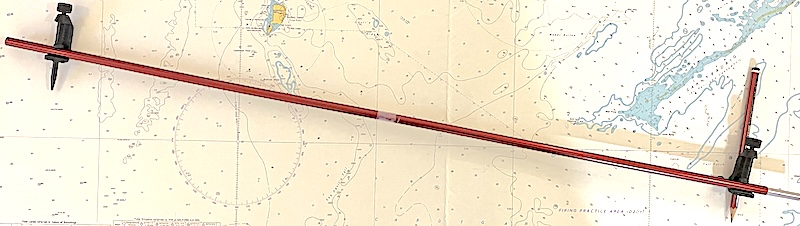
For measuring and marking off larger distances, it’s possible to use the scale on a plotter or a long ruler. The right tool for the job is a beam compass or trammel.It’s now possible to buy these fairly cheaply online, but this hasn’t always been the case. I made mine from a pair of cheap trammel points attached to an old tent pole section:
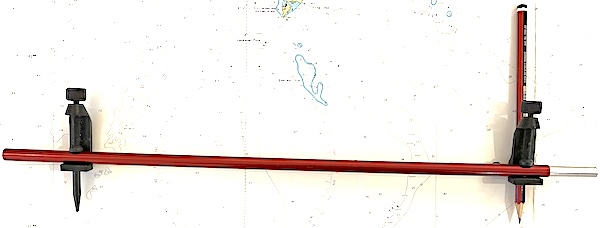
Of course, the device can be made even longer by slotting on another section of tent pole and securing it with a bit of tape:
Most people are able to do without a beam compass, but it’s a nice to have if you’re planning lots of chart work, perhaps in the run up to an advanced leader assessment.
5.2.1.1 Measuring bearings
The plotter can be used in the same way as a hiking compass to measure a bearing off the chart
Find the bearing of the Causeway Buoy from the West Island of the Saint Tudwal’s Islands.
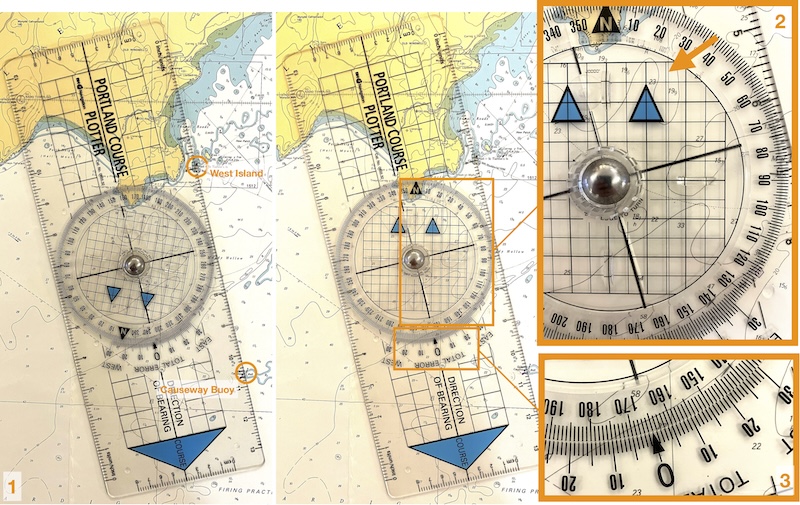
1: Place the plotter on the chart so that the bearing line is along one of it’s edges. Here we ensure that both the West Island and the Causeway Buoy are on the edge of the plotter.
2: Rotate the bezel of the plotter until the arrows on the bezel point to the north direction of the chart. Notice here how one of the vertical lines on the bezel has been carefully aligned with one of the gird lines on the chart (arrow).
3: Read off the bearing from the plotter - it’s 165˚, as measured at the ‘0’ arrow.
5.2.1.2 Marking vectors
We often need to mark lines of a defined length and direction to denote bearing of tidal drift or distance paddled. To do this, we use the plotter to find the correct direction and the dividers to transfer the required distance from the chart’s scale.
*Draw a 3 nautical mile line at bearing 130˚ from Carreg Ddu to denote tidal drift
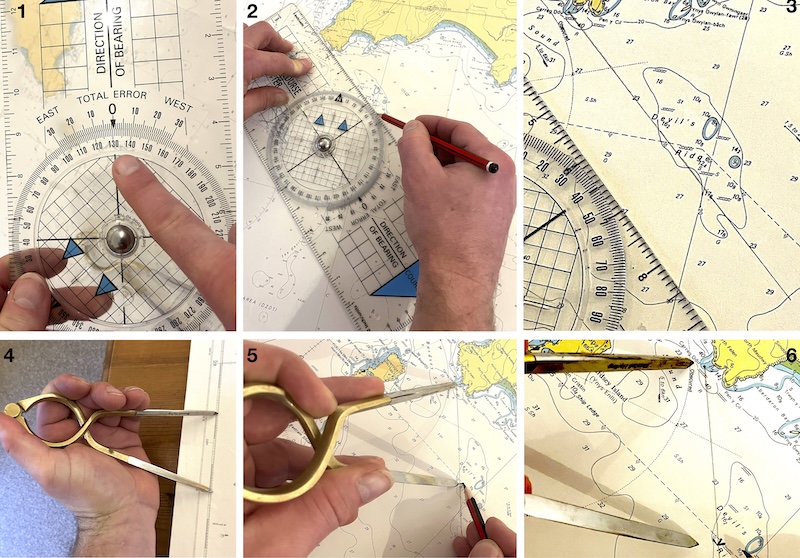
1: Set the plotter to the required bearing of 130˚
2: Place the plotter on the chart so that the lines and arrows on the bezel are aligned to north. Slide the plotter until its edge is at Carreg Ddu. Draw a line from Carreg Ddu that is somewhat longer than the 3 nautical miles required
3: The pencil line drawn at 130˚ from Carreg Ddu
4: Set the dividers to 3 nautical miles. Here the latitide scale on the chart is used
5: Place one point of the dividers at Carreg Ddu. Mark where the other point lies on the line.
6: Completed vector.
5.2.2 Long crossings
We’ve already looked at crossings of channels with tidal flow where the crossing took around an hour or less. With these short crossings, it’s reasonable to assume that the tidal stream remains constant throughout the crossing, making the vectors approach fairly simple.
If you’re planning a crossing that’s going to take several hours, the tidal stream is going to change its speed and possibly its direction during the crossing. Clearly that needs to be taken into account when planning the crossing.
5.2.2.1 Option1: Multiple 1 hour vectors
A simple approach to planning a long crossing is simply to apply the simple vectors approach to short crossings to each hour, aiming to stay on a straight line between the start and finish points. This works. Here’s a long crossing planned out using this technique:
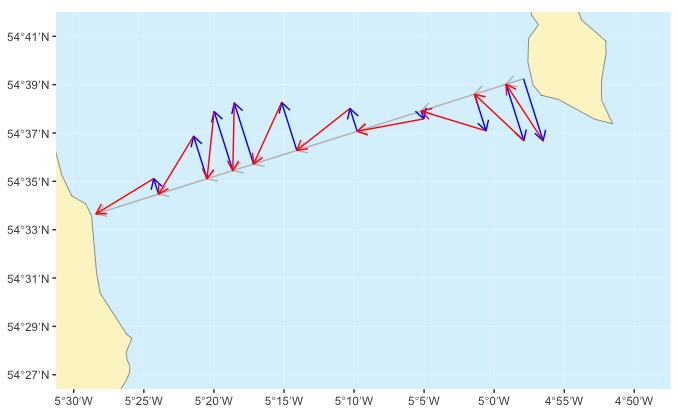
Long crossing (Crammag Head, Mull of Galloway to Ballywalter in Northern Ireland) planned using a series of 1-hour vector triangles
For each hour, a blue vector has been drawn to represent how far the tide would make the kayak drift if the paddler did nothing for the hour. Then a red vector, representing the paddling speed had been added between the tip of the blue arrow and a (grey) line drawn between start and finish points for the crossing. As we saw in the simple vectors approach, the angle of the red arrows needs to be adjusted such that the end reaches the grey line.
As you can see from the map, the crossing is planned to take 10 hours. The paddler will need to adjust the bearing on which they paddle every hour. During some hours - e.g. the 1st and the 7th, the paddler makes very little progress towards their destination - they’re mostly just fighting the tide. And the paddler begins the crossing by paddling north-west to fight the tide…. but ends it by padding south-west against the tide once it’s turned.
So, whilst this method does work, it doesn’t seem to be very efficient. Let’s look at a better approach.
5.2.2.2 Option 2: Vectors over several hours
The big problem with the previous approach was that the paddler spends a lot of time fighting the tide in one direction, then the opposite direction. It would be better to simply let the tidal stream push the paddler south for the first 4 hours, then let the stream push them back northwards. Here’s the same trip, with the same tidal streams and paddling speed planned with this approach:

Long crossing planned with a constant course to steer
With this approach, the paddler steers a constant bearing throughout the entire crossing (red arrows). The tide (blue arrows) pushes the paddler south during the start of the crossing, then back north. Their course isn’t a straight line, but follows a curve (grey arrows). And notice that the crossing now only takes 7 hours to complete - little or no time is wasted paddling against the tide.
5.2.2.3 Introduction to multiple hour vector method
So, how do we calculate the course to steer for this more efficient approach? We begin by laying out all the tidal stream vectors, end to end for all the hours of the crossing:
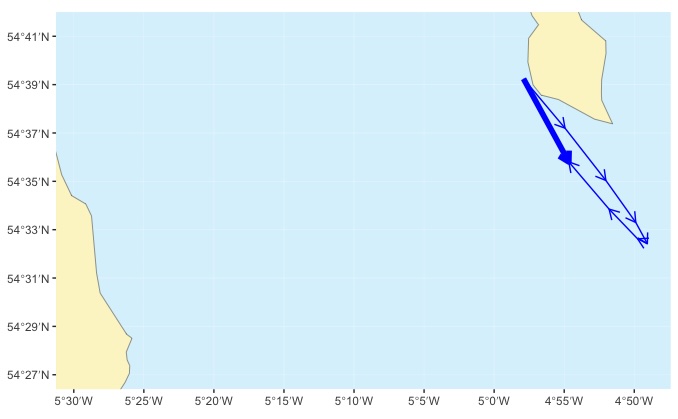
These (thin blue) arrows represent what would happen to the boat if we simply let it drift for 7 hours. If we want to, we can represent the total tidal drift by a single arrow (thick blue) that represents the total effect of the stream over the entire 7 hour crossing.
We now have a vector for the tidal effect, just like we had for the 1 hour vector triangle. We also know how far we can paddle during the crossing - it’s simply the crossing time (7 hours) multiplied by our paddling speed (e.g. 3 knots - to give 3X7 = 21 nautical miles). We have everything we need to draw a vector triangle that represents the entire 7 hour crossing, setting the direction of the 21 mile arrow so that it meets a line drawn from departure point to destination:
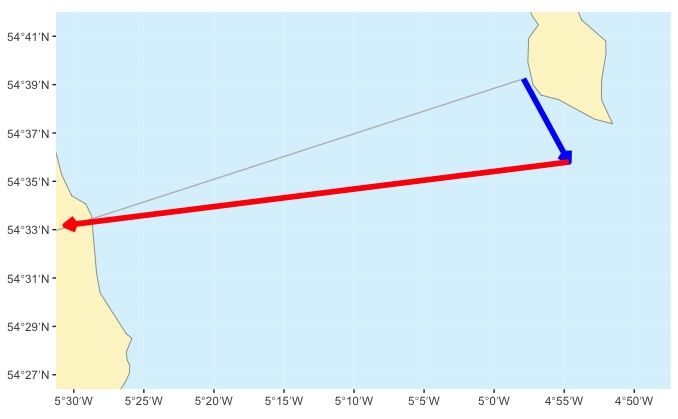
Vector triangle drawn for entire 7 hour crossing
The bearing of the red arrow (~260˚) tells us the course we need to steer throughut the crossing. Note that the point where the paddling speed vector (red arrow) meets the line drawn from departure point to destination (grey line) is slightly beyond the destination. This simply indicates that the crossing will take a little less than 7 hours to complete.
If we like, we can now find our where we’re going to be during the crossing - remember that using this technique, we’re likely to end up following a curved path. We simply lay out the tide and paddling vectors for each hour:
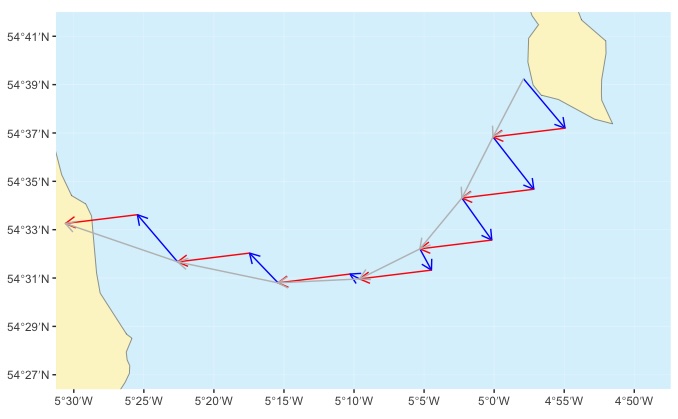
Vectors laid out for each hour of the crossing to give the course that will be followed
For the first hour, we draw the tide vector for hour 1 (furthest right blue arrow) and draw a paddling vector with length equal to our speed (e.g. 3 knots / 3 nautical miles) along the bearing that we calculated for the course to steer (260˚) (furthest right red arrow). The end of this red arrow tells us where we’ll be after 1 hour of paddling.
For the second and subsequent hours, we do the same, starting at at the calculated position for the previous hour. This gives us the position at the end of each hour and our actual course (grey arrows). If you’ve got everything right, the final position should be somewhere near your planned destination.
That’s a very high level explanation of a somewhat complex process that requires a lot of chart work. We’ll go through it slowly, with an example, over the next few sections
For our example, we’ll plan a crossing from Burrow Head in southern Scotland to Point of Ayre, the northern point of the Isle of Man in August 2025.
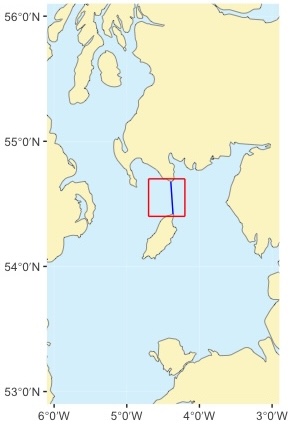
Crossing from Burrow Head to Point of Ayre (Isle of Man) - blue line. The area shown on the simplified chart is shown as a red box.
We’d likely plan this crossing on Admiralty chart 2094 “Kirkcudbright To Mull of Galloway & Isle of Man”, and the example will work fine if you want to do that. However, to make things easier to see, and to provide a chart that you’re able to print off without contravening copyright, We’re going to use the simplified chart here:
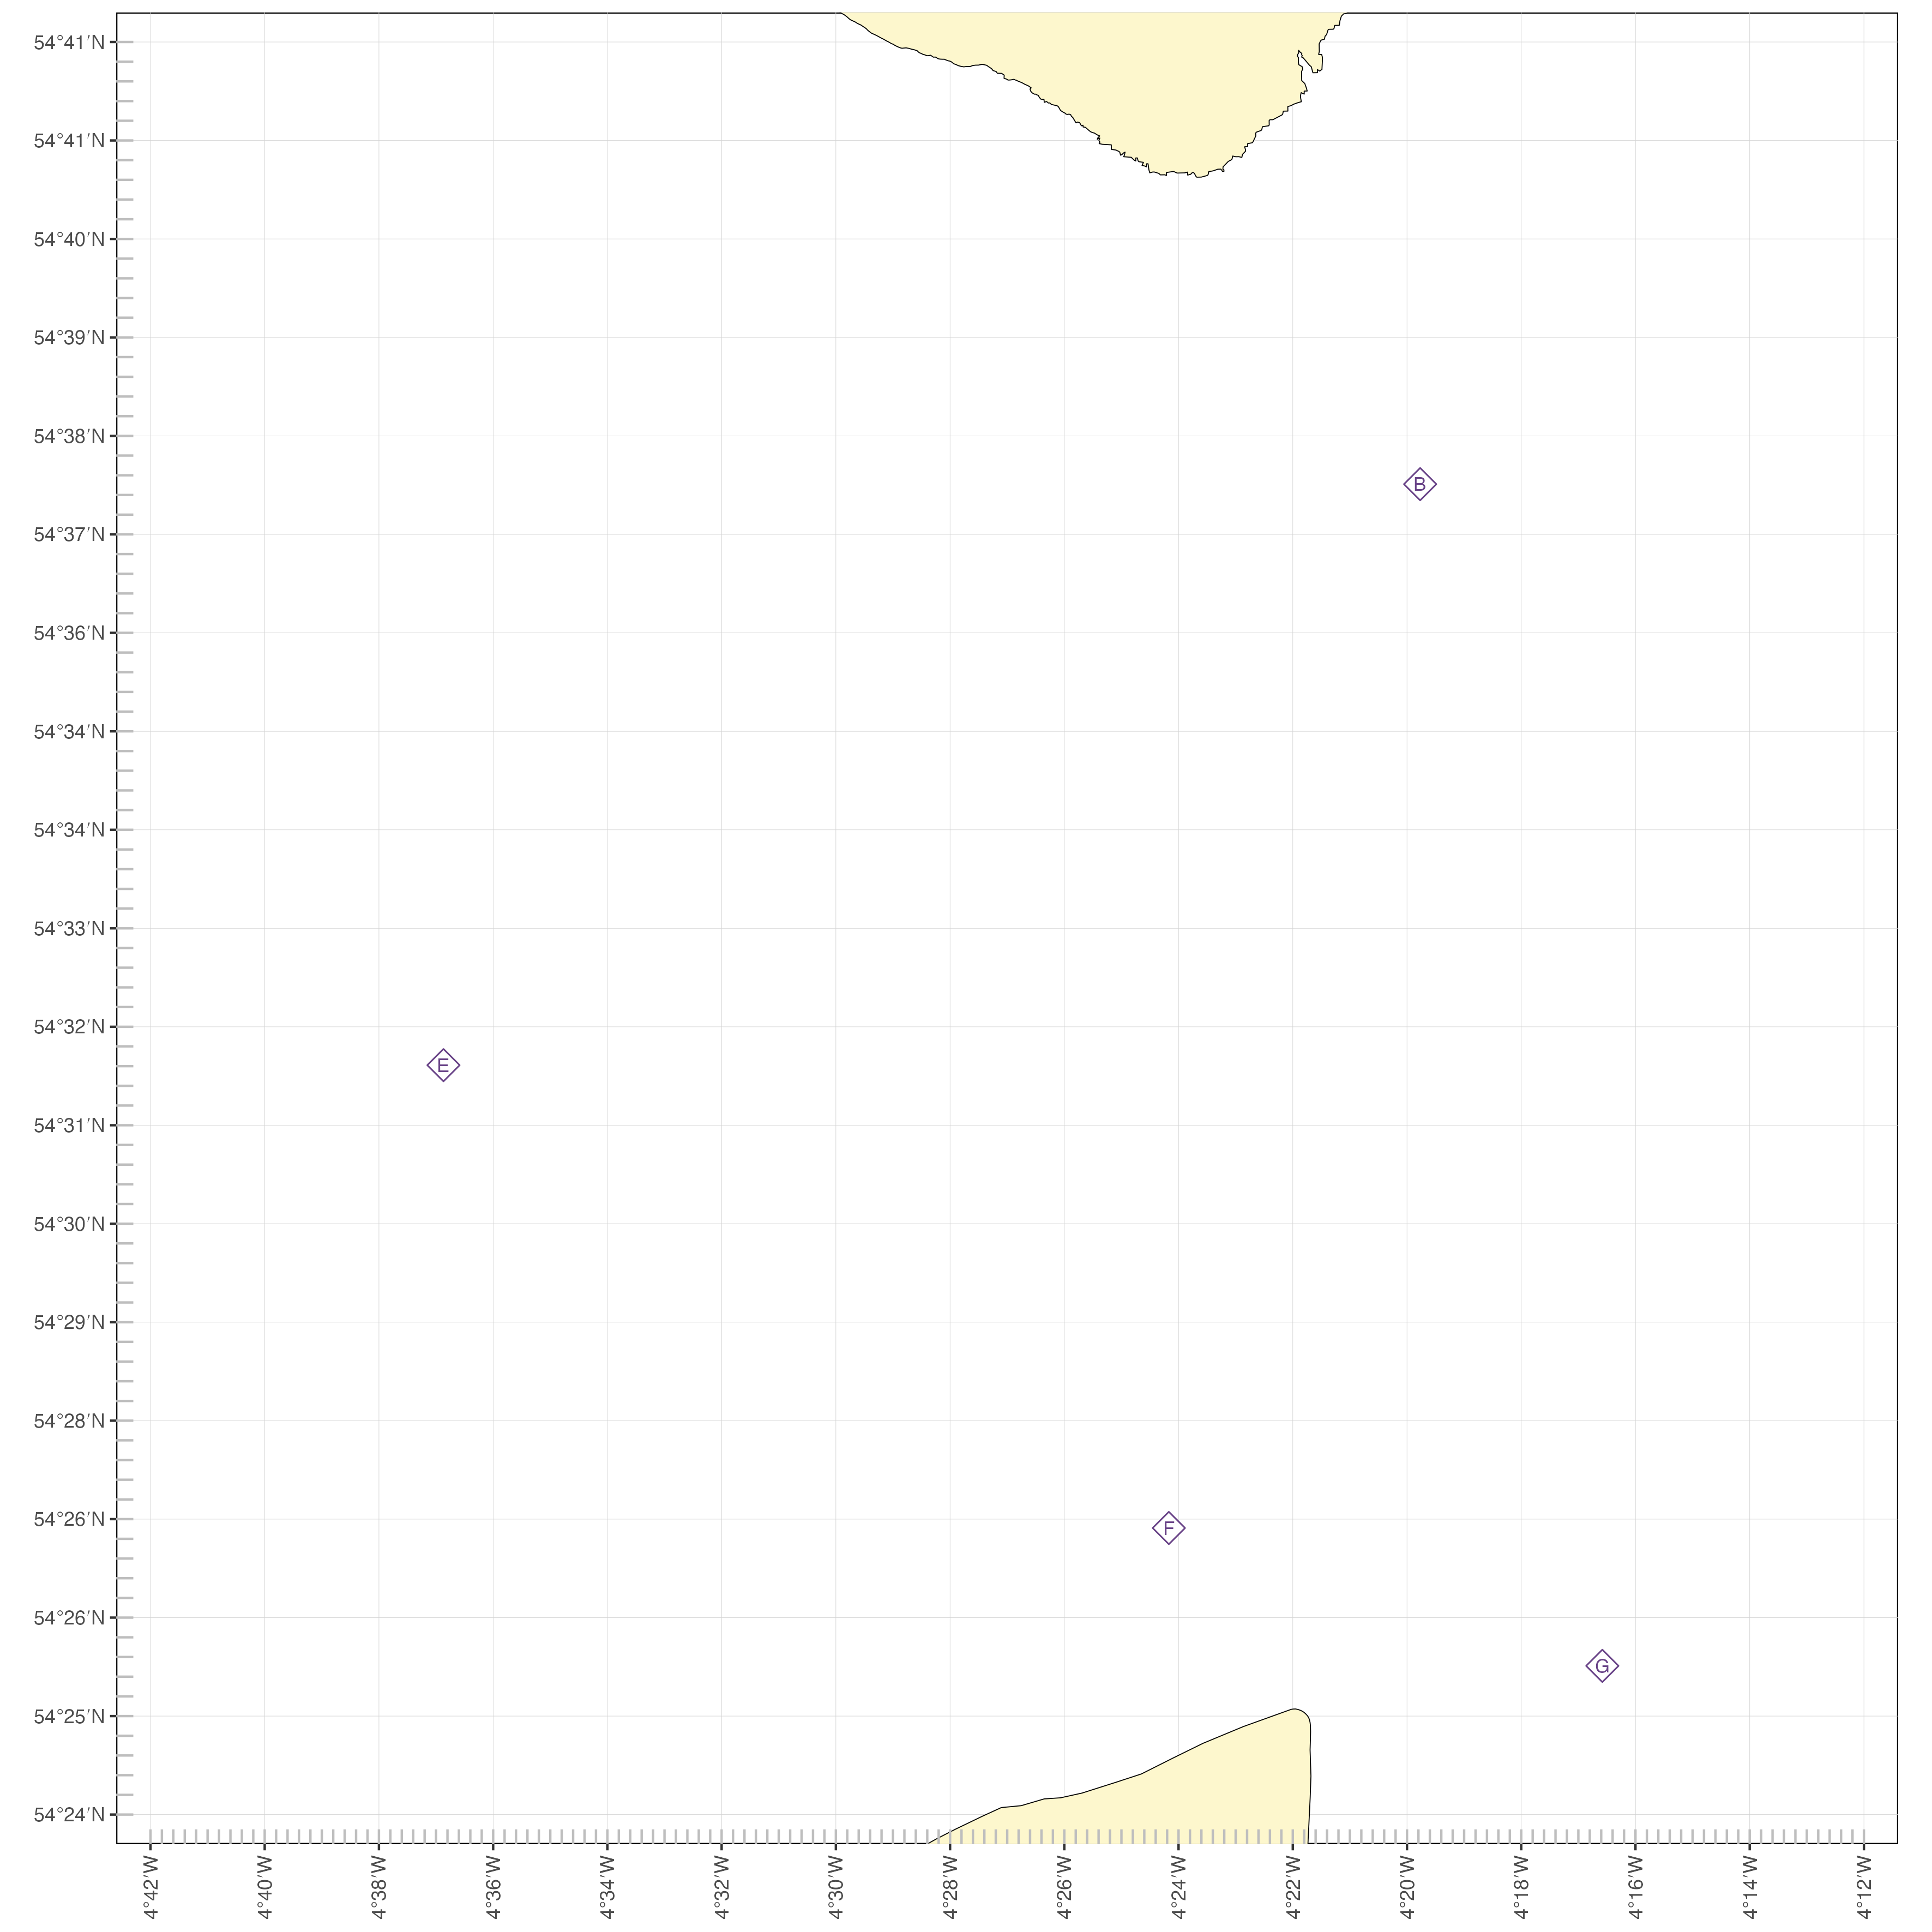
Simplified chart of the area between Burrow Head and Point of Ayre. Feel free to open this image in a different tab and print if off large to allow you to follow along with the example.
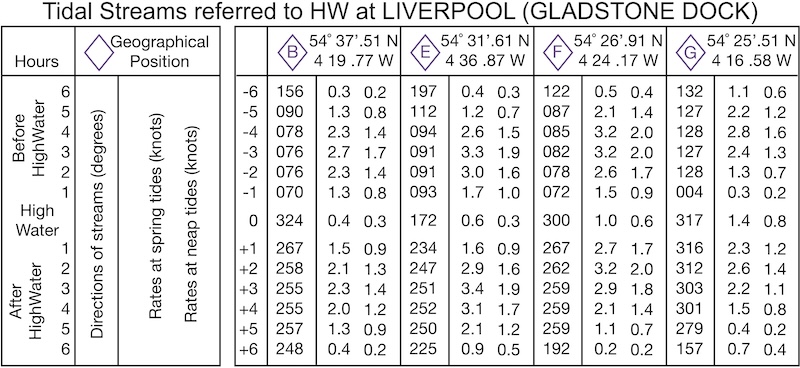
The chart has 4 tidal diamonds on it. Here’s the data for those diamonds:
We’ll show how to use this information to plan the crossing in subsequent sections.
5.2.3 Choosing when to make the crossing
The first decision to make when planning a crossing is to choose when to go. The tidal streams that affect the crossing will make the journey much easier at some times than others. Often, tidal stream atlases can be a good source of information to gain the overview needed to begin thinking about this.Factors to consider include:
Whether it is springs, neaps or in between. The effects of the tide will be less around neaps, increasing margins for errors.
When the tide will turn. For crossing that cross the tide (e.g. most crossings from the UK mainland to Ireland), it makes sense to choose slack water in the middle of the crossing so that the effects of the tide cancel over the crossing and no net effort is put into paddling against the tide. For crossings in the direction of the tide (e.g. Ilfracombe to Lundy), it makes sense to cross when the tide will assist your passage.
Areas of overfalls. For some crossings, it will be important to avoid areas of overfalls and races when the tide is strong. For this reason, you might choose to arrive at a destination headland at slack water.
Periods of daylight. Some otherwise perfect time windows may be in the middle of the night, which is obviously not ideal. It may well be better to start the crossing in the dark than be chasing the last light at the end of the crossing.
It is possible that you will need to make some compromises. In some areas, picking neap tides will mean that the only usable slack water is in the middle of the night. Clearly, it’s not possible to time slack water for both the middle of your crossing and your arrival at a headland.
Obviously, the weather will determine whether it’s sensible to undertake the crossing - most people will only contemplate a multi-hour crossing in settled conditions. It may turn out that the day you pick has poor weather, and you’ll have to leave the crossing to another opportunity. Tidal conditions tend to be similar from one day to the next, so you may be able to pick the best day from 3 or 4 that all have a sensible tidal setup.
Here’s an extract from a tidal stream atlas showing the area between Burrow Head and the Point of Ayre
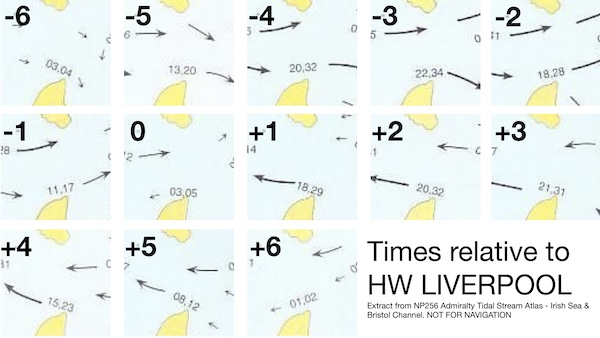
It appears that slack water is around high water Liverpool and HW Liverpool +6:30 (i.e. LW Liverpool). Around high water Liverpool, it looks like the tidal stream at Point of Ayre turns a little ahead of the main stream.
The distance of the crossing is around 15 nautical miles, so we expect it to take around 5 hours. We’ll arrange for the middle hour of the crossing to be around slack water at HW Liverpool (or LW ), so that we start around 2 and a half hours before high water or low water at Liverpool and finish 2 and a half hours after. So, we’re looking for days with a small tidal range and HW or LW near the middle of the day.
We’d like to do the crossing in August 2025. Here’s a tide table for that month:
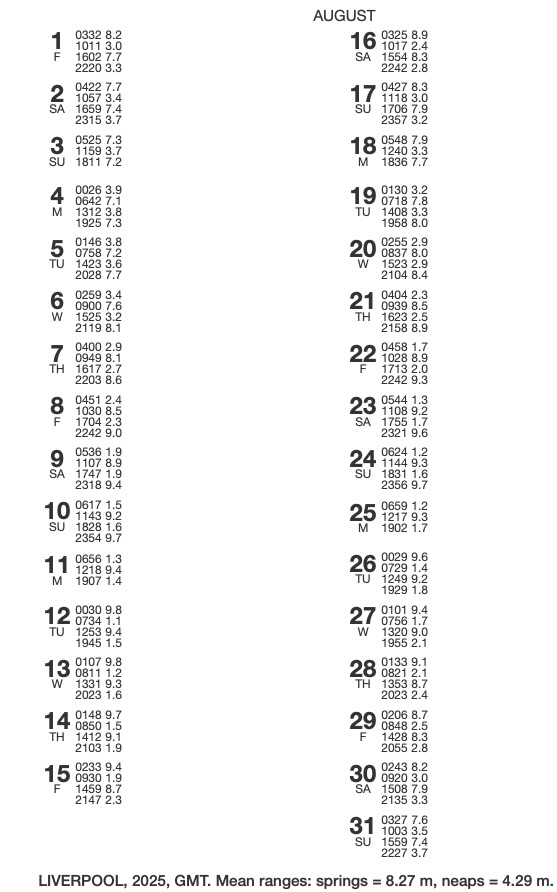
The smallest tidal range of the month is August 4th. On this day, we might use the low water slack at 14:12 (accounting for BST). Similar conditions, with slightly larger tidal ranges occur on the 18th and 19th. These days look optimal from a tidal perspective.
However, to make some of the principles clearer in this example, we’ll choose a day with a rather larger tidal range - the 9th August. On this day, high water is at 12:07 BST and the tidal range is 7 metres. For simplicity, we’ll assume high water at 12:00. The timings for the crossing are thus:
| Time relative to HW Liverpool | Time (BST) | Expected tidal stream |
|---|---|---|
| -2 (-2:30 to -1:30) | 09:30-10:30 | East-going, strong |
| -1 (-1:30 to -0:30) | 10:30-11:30 | East-going |
| 0 (-0:30 to +0:30) | 11:30-12:30 | Slack |
| +1 (+0:30 to +1:30) | 12:30-13:30 | West-going |
| +2 (+1:20 to +2:30) | 13:30-14:30 | West-going, strong |
We’ll update this table as we gather more information about the tidal streams.
This plan involves us arriving at Point of Ayre with a strong west-going tide running. We may wish to check how severe the overfalls are likely to be at the Point, and devise a plan that enables us to land to the west of the point should we get swept in this direction.
5.2.4 Finding tidal stream data for long crossings
The tidal stream data that we use for crossings can come from any of the usual sources - e.g. pilots, guidebooks or stream atlases. If we’re going to use the information for formal navigation, it makes sense to use the most accurate data that we can. Where possible, we’ll tend to use tidal diamonds. However, in some places there simply aren’t tidal diamonds available and in others we may need to augment them with other information sources, for example to account for faster flows near the shore.
During a long crossing, we may pass through areas that have different tidal streams. We need to decide what source of information to rely on for each hour of the crossing.
To do this, we need to estimate where on the crossing we expect to be at each hour. To do this, draw a line from the start point to the end point, and mark off 1 hour distances each corresponding to a hour’s paddle (e.g. 3 nautical miles for 3 kt paddling speed):
This approach assumes that our progress along the crossing won’t be greatly affected by the tide. This is reasonable for crossings across the tide with slack water in the middle of the crossing. If we’re paddling down tide, we can modify our speed accordingly.
We can now choose which tidal data to use for each hour. In the illustration above, we might choose to use:
Data from pilot books or guidebooks, shown as blue arrows, for hours 1 and 4 to account for the stronger flows inshore
Diamond D for hour 2
Diamond F for hour 3
Of course, this choice is subjective. If we believe that the inshore flow at the western end of the crossing is very localized near the coast, we might choose to use diamond F for hour 4… and plan to deal with the localized flow once we get there - perhaps using transits, or planning to arrive suitably up-tide of our final destination.
We’ll need to use the techniques that we’ve learned in earlier sections to determine the tidal flows that we expect on the day in question.
For our example crossing, the best information available is from a series of tidal diamonds. We need to decide which to use for each hour.
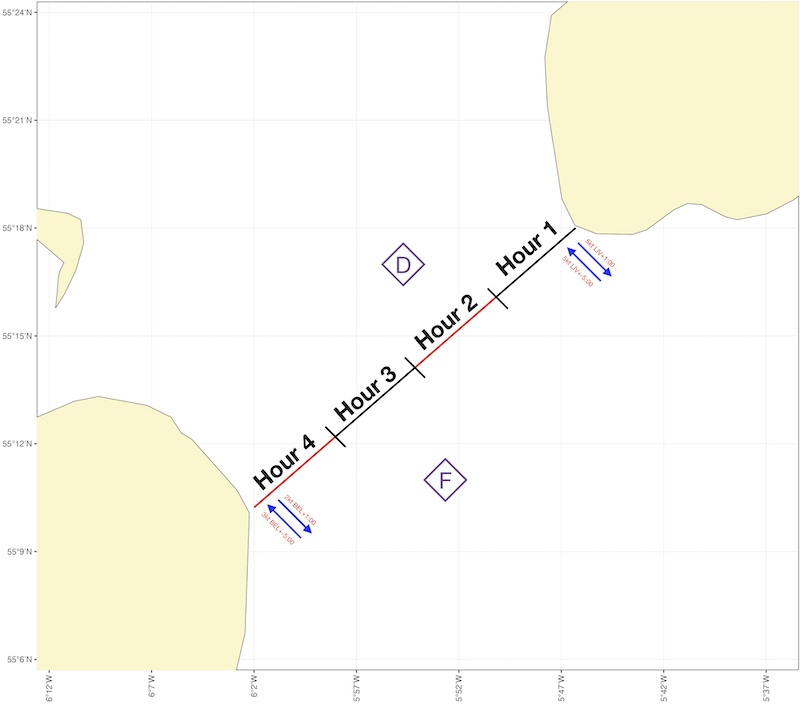
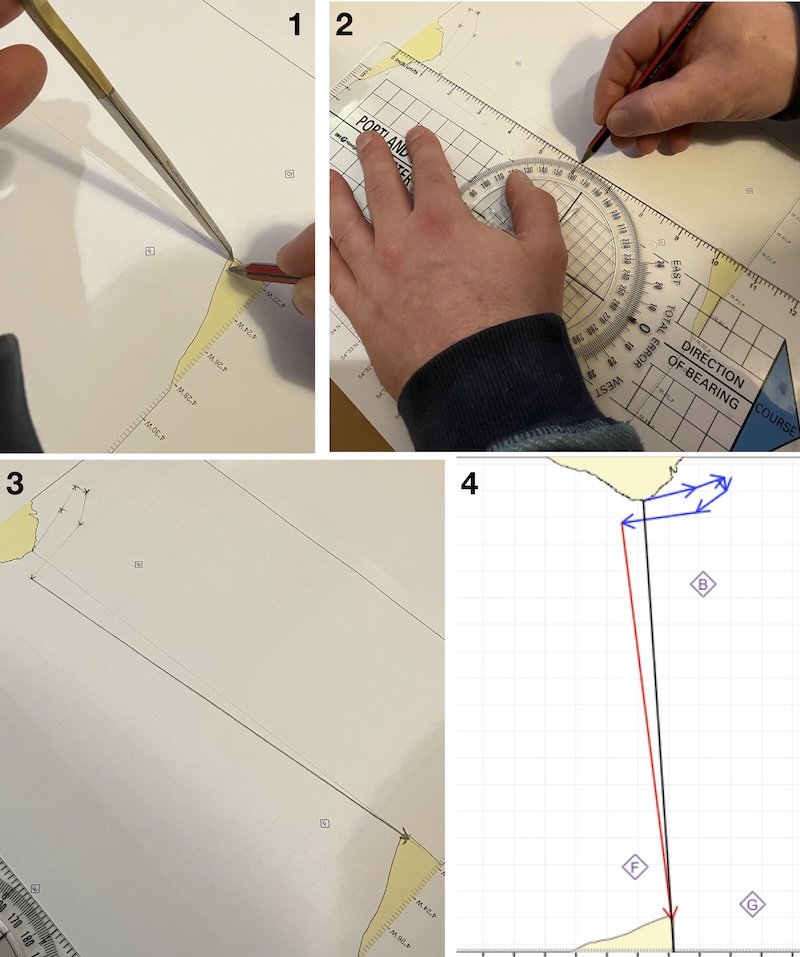
Begin by drawing a line from the start point of the crossing to beyond the end (the extended line will be useful later). Then mark off each hour of paddling distance along the line. On this crossing, we expect to paddle at 3 knots, so we mark every 3 nautical miles:

Marking the line from start point to destination and dividing it into hours. 1,2 drawing a line from start point to destination - the plotter is simply being used as a ruler here. 3 setting the dividers to 3 nautical miles using the latitude scale. 4 ‘walking’ the dividers along the line and marking off 3 nautical mile segments
The final result is shown below:
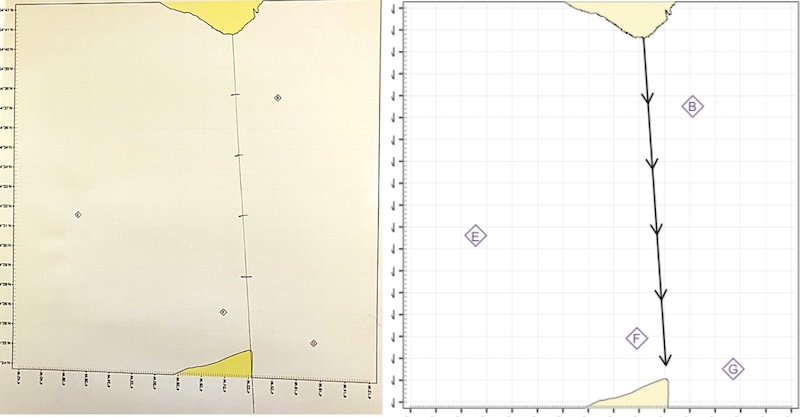
Crossing marked up with 1 hour segments - pencil drawing on left, schematic on right
We can now decide which diamonds to use for each hour of the crossing. Clearly, we will want to use diamond B for the first 2 hours. Diamond F would be a good choice for the final hour (it’s closer to the crossing line than diamond G), but will likely be too much affected by it’s proximity to the Point of Ayre to be a sensible choice for other parts of the crossing.
For hours 3 and 4, you could choose to use either diamond B or diamond E. Diamond B might better reflect the way the tide is ‘squeezed’ into the channel that we’re crossing, but diamond E may better reflect the conditions in the middle of the channel. Looking a a tidal stream atlas might help you to make the choice, but it is subjective. We’ll choose diamond E:
| Time relative to HW Liverpool | Time (BST) | Source of tidal data |
|---|---|---|
| -2 (-2:30 to -1:30) | 09:30-10:30 | Diamond B |
| -1 (-1:30 to -0:30) | 10:30-11:30 | Diamond B |
| 0 (-0:30 to +0:30) | 11:30-12:30 | Diamond E |
| +1 (+0:30 to +1:30) | 12:30-13:30 | Diamond E |
| +2 (+1:20 to +2:30) | 13:30-14:30 | Diamond F |
We can now copy the required data from the tidal diamonds. The required information is highlighted below and captured in the next version of our table:
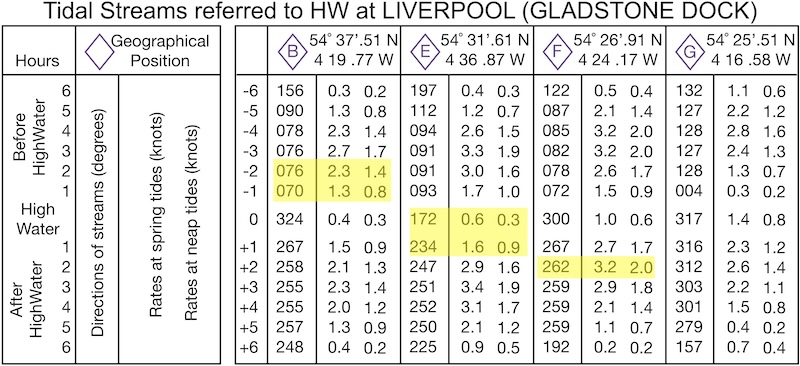
| Time relative to HW Liverpool | Time (BST) | Source of tidal data | Bearing | Spring rate | Neap rate |
|---|---|---|---|---|---|
| -2 (-2:30 to -1:30) | 09:30-10:30 | Diamond B | 76˚ | 2.3 kt | 1.4 kt |
| -1 (-1:30 to -0:30) | 10:30-11:30 | Diamond B | 70˚ | 1.3 kt | 0.8 kt |
| 0 (-0:30 to +0:30) | 11:30-12:30 | Diamond E | 172˚ | 0.6 kt | 0.3 kt |
| +1 (+0:30 to +1:30) | 12:30-13:30 | Diamond E | 234˚ | 1.6 kt | 0.9 kt |
| +2 (+1:20 to +2:30) | 13:30-14:30 | Diamond F | 262˚ | 3.2 kt | 2.0 kt |
We can now use the tidal range on the day we’ve chosen for the crossing (7 metres) together with the neap and spring ranges at Liverpool (8.27, 4.29 metres) to calculate the expected flow on August 9th. We might use a graphical or a numerical method to do this - see the earlier notes on ‘Predicting speeds of tidal streams’ for how to do this. Here’s the results:
| Time (BST) | Source of tidal data | Bearing | Spring rate | Neap rate | Expected rate August 9th |
|---|---|---|---|---|---|
| 09:30-10:30 | Diamond B | 76˚ | 2.3 kt | 1.4 kt | 2.0 kt |
| 10:30-11:30 | Diamond B | 70˚ | 1.3 kt | 0.8 kt | 1.1 kt |
| 11:30-12:30 | Diamond E | 172˚ | 0.6 kt | 0.3 kt | 0.5 kt |
| 12:30-13:30 | Diamond E | 234˚ | 1.6 kt | 0.9 kt | 1.4 kt |
| 13:30-14:30 | Diamond F | 262˚ | 3.2 kt | 2.0 kt | 2.8 kt |
5.2.5 Plotting tidal streams
Now we’ve determined the tidal streams for each hour of the crossing, we plot the tidal drift for each hour of the crossing onto our chart. We plot the tidal vectors end to end, reflecting the fact that we expect the tidal drifts to occur sequentially through the crossing:
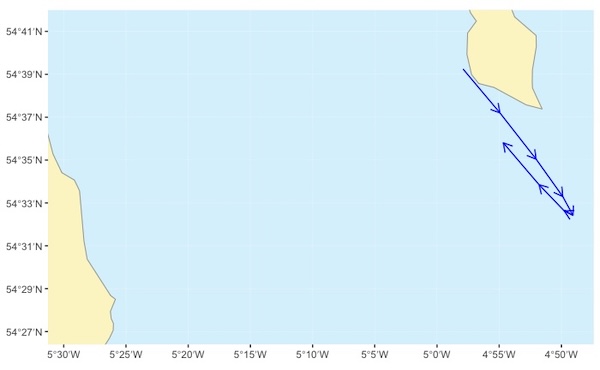
At this stage, we can see the aggregate effect of our tidal drift through the crossing. In the example above, it’s somewhat to the south. This might be ideal if our crossing heads SSW, but if we’re planning a directly westerly track, we might want to reconsider the timing of our crossing. In the example above, we might consider leaving an hour later to see if that makes the aggregate effect of the tidal streams less.
In the previous section, we calculated the tidal flow for each hour of our example crossing:
| Time (BST) | Bearing | Expected rate August 9th |
|---|---|---|
| 09:30-10:30 | 76˚ | 2.0 kt |
| 10:30-11:30 | 70˚ | 1.1 kt |
| 11:30-12:30 | 172˚ | 0.5 kt |
| 12:30-13:30 | 234˚ | 1.4 kt |
| 13:30-14:30 | 262˚ | 2.8 kt |
So we’re going to mark a series of arrows:
For hour 1: at a bearing of 76˚, with a length of 2 nautical miles
For hour 2: at a bearing of 70˚, with a length of 1.1 nautical miles
etc…
Begin by marking the first hour’s tidal drift: 2 nm at 76˚:
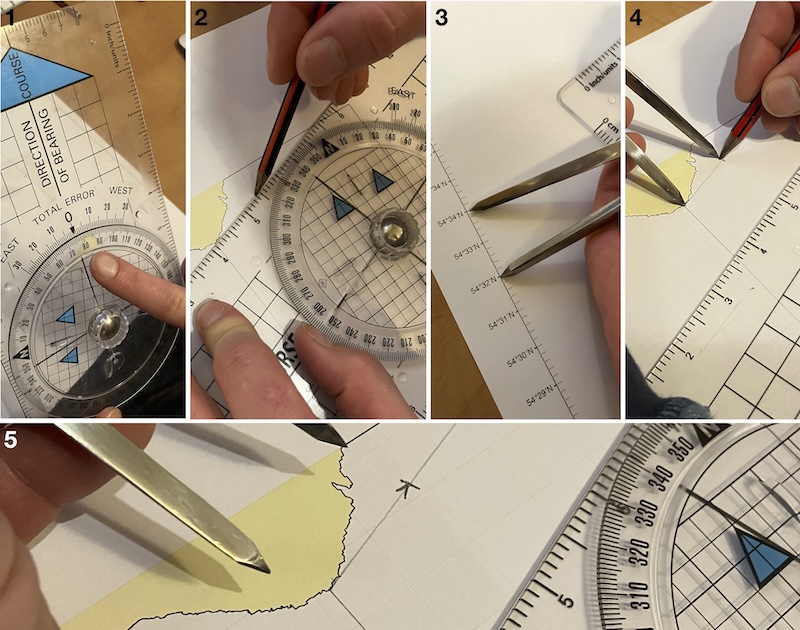
Marking 2 nautical miles of tidal drift at 76˚. 1: set plotter to 76˚. 2: Align plotter to chart north and mark a line at 76˚ from the departure point. 3: Set dividers to 2 nautical miles using latitude scale. 4: Mark 2 nautical miles along the marked line. 5: completed arrow.
Now we mark the remaining hours end to end:
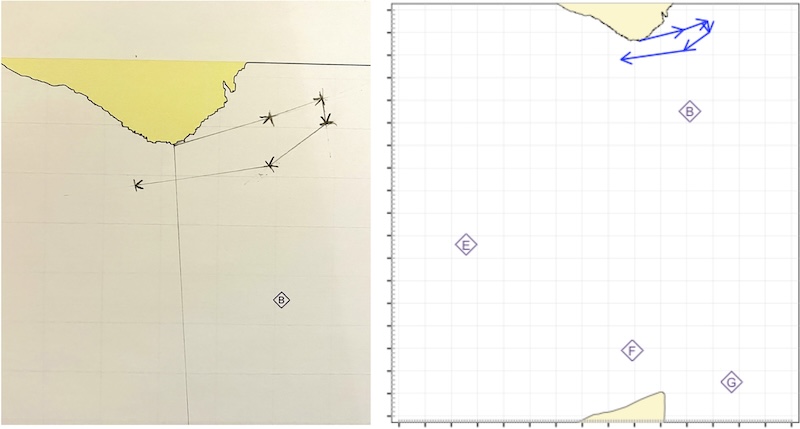
All the tidal drift vector marked on the chart in pencil (left) and on the schematic (right)
5.2.6 Finding the course to steer
We now need to determine the course to steer. This process is similar to that which we used for short crossings.
We set a compass or a pair of dividers to the total distance that we plan to cover in the planned duration of the crossing. We place one point of the dividers at the end of our final tidal drift arrow, then swing them until they reach the line drawn from our start point through the destination:
As for short crossings, we need to avoid the error of drawing this arrow to the destination point. However, with these longer crossings, it is likely that the arrow will end up close to the destination point. If it does not, we may have accounted for too many or too few hours of tidal drift.
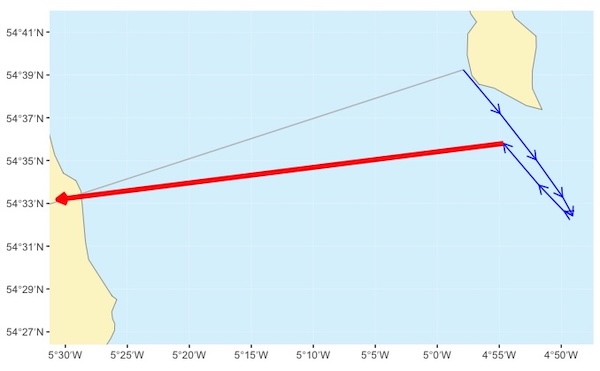
We set the dividers to the total distance that we plan to paddle - 5 hours at 3 knots = 15 nautical miles. We then place one point at the end of our final tidal drift arrow and swing the dividers until they meet the planned course line:
We now mark off the point where the divider point meets the course line and draw our course to steer vector:
Constructing the course to steer line. 1: Marking off where the dividers intersect the planned track line. 2: Using the plotter as a ruler to draw a line from the end of the tidal drift arrows to this mark. 3: Finished course to steer line. 4: Course to steer line (red) on schematic chart.
Finally, we can use the plotter to measure the bearing of the course to steer. Once we’ve corrected for magnetic deviation, this is the compass course for us to steer during the crossing.
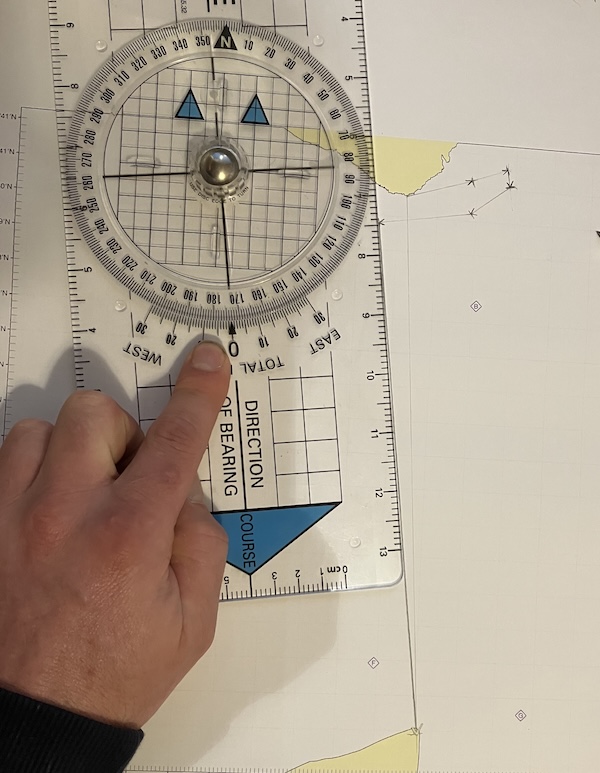
Measuring the course to steer using a plotter. It’s about 173˚.
5.2.7 Determining estimated positions
We’ve determined a course to steer, which we intend to hold constant throughout the crossing. We know that the tidal stream will vary through the crossing, so we’ll follow a curved track relative to the seabed. It is useful to find out what this track will be. Firstly, this allows us to check that we’re not going to end up somewhere that we don’t want to be - e.g. in a shipping lane or an area of overalls. Secondly, we can use these estimated positions to check our progress - by comparing them to our actual positions each hour, determined by GPS or other means.
The estimated positions are used by sequentially laying out the tidal drift vector (different each hour), then the paddling vector (the same each hour).

In the diagram, the tidal drift arrows are shown in blue and the paddling arrows in red. We’ll follow a track that is close to the grey line.
We’ll remind ourselves of the tidal drifts we expect each hour for our example crossing:
| Time (BST) | Bearing | Expected rate August 9th |
|---|---|---|
| 09:30-10:30 | 76˚ | 2.0 kt |
| 10:30-11:30 | 70˚ | 1.1 kt |
| 11:30-12:30 | 172˚ | 0.5 kt |
| 12:30-13:30 | 234˚ | 1.4 kt |
| 13:30-14:30 | 262˚ | 2.8 kt |
In the previous section, we calculated that our course to steer is 173˚ - and, of course, our paddling vectors will be 3 nautical miles for each hour given our 3 knot paddling speed.
So, we’ll draw out:
Hour 1 tidal drift arrow: 2 nautical miles at 76˚
Hour 1 paddling arrow: 3 nautical miles at 173˚
Hour 2 tidal drift arrow: 1.1 nautical miles at 70˚
Hour 2 paddling arrow: 3 nautical miles at 173˚
Hour 3 tidal drift arrow: 0.5 nautical miles at 172˚
Hour 3 paddling arrow: 3 nautical miles at 173˚
etc…
We’ll end up with a plot that looks something like this:
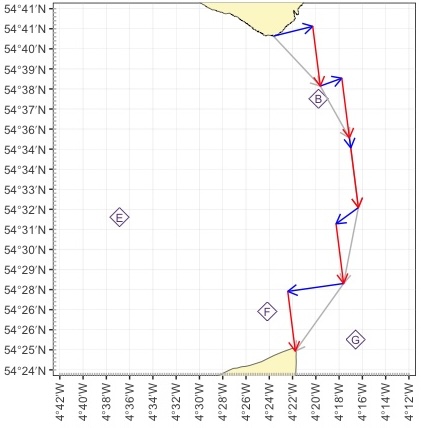
The tidal drift arrows for each hour are shown in blue, the paddling arrows in red. Our course is going to follow the grey lines.