2.4 Paddling with tidal flow: Predicting speeds of tidal streams
2.4.1 Changes between neaps and springs*
We have focused so far on determining which way the tidal stream will be flowing and when. This is often enough to plan a simple sea kayak journey. However, it is sometimes useful to estimate the speed of the tide with greater precision.
Information from either tidal diamonds or a tidal stream atlas can give information on flow speeds at springs and neaps for each hour. What if it isn’t springs or neaps?
There are two methods to calculate tidal flows – using factors and using interpolation. Factors are quicker, but interpolation may be a little more accurate.
We calculated a tidal factor earlier as the ratio between the actual tidal range and the range at mean springs. Given that the tidal range is what drives the tidal streams, we can simply multiply the factor by the flow speed at springs to estimate the speed that we will experience.
What will the maximum flow be in St. Mary’s Sound on 1 June 2020?
We previously consulted a tidal diamond (and a pilot) and found that maximum flow speed in the Sound is 1.7 knots at springs (and 0.8 knots at neaps).
Consulting the Plymouth tide table….
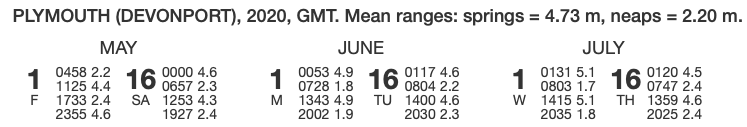
First row of tide table for Plymouth
The tidal range on June 1st is 4.9-1.8 = 3.1 meters. Given that the mean range at springs is 4.73m, the factor is 3.1/4.73 = 0.65 - i.e. between springs and neaps.
We estimate the maximum flow as 0.65 X 1.7 = 1.1 knots.
Interpolation The method of interpolation uses both the springs and neaps flow speeds and associated tidal ranges to calculate flow speed at an intermediate tidal range. This can be done using an equation or graphically. The equation is:
\[ speed@neaps+\left(speed@springs-speed@neaps\right)\frac{range-range@neaps}{range@springs-range@neaps} \]
Using this is clearly a pain, so the calculation is more commonly done graphically using a plot found on the inside cover of a tidal stream atlas:
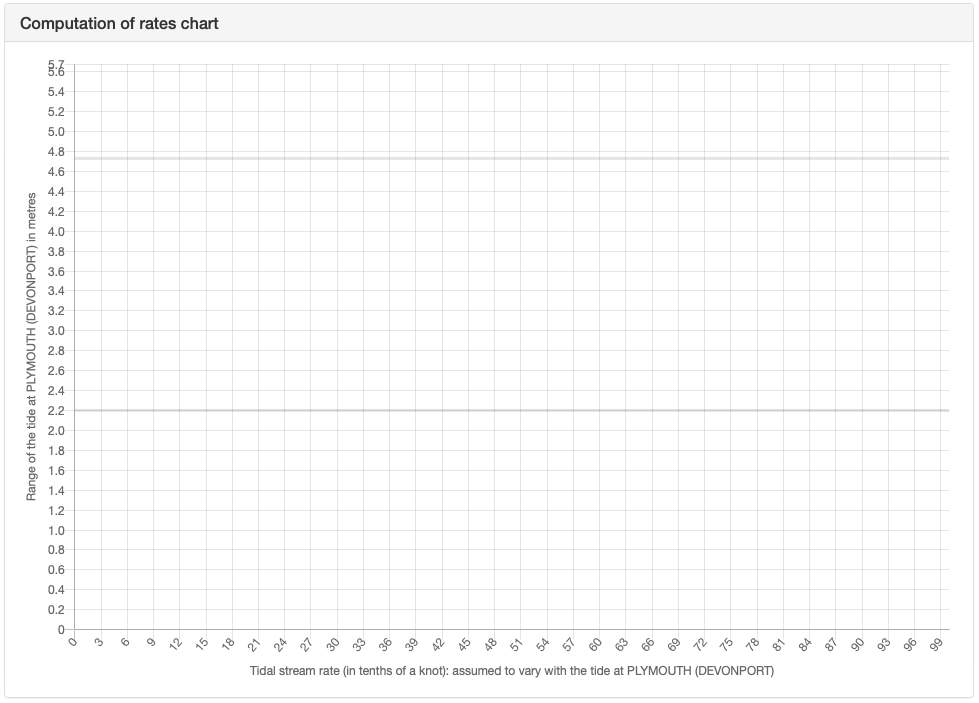
Plot for interpolation of rates
Tidal stream flows for both springs and neaps are plotted on this diagram against the corresponding tidal ranges – mean springs and neaps ranges being shown on the diagram. A straight line is drawn between these two points. This line can be used to calculate a speed for any given tidal range. An example will help explain:
Estimate the fastest speed of tidal flow in Saint Mary’s Sound on 1 June 2020?
We previously consulted a tidal diamond and found that maximum flow occurs at HW Plymouth and 4 hours later and is 1.7 knots at springs, 0.8 knots at neaps.
We also know from the tide tables that:
range at mean springs = 4.73 m
range at mean neaps = 2.20 m
Note that these correspond to the position of the dotted lines on the computation of rates chart, as we would expect. The tidal range on June 1st is 3.1 m.
USING THE EQUATION:
Speed = speed@neaps + (speed@springs - speed@neaps)X(range - range@neaps)/(range@springs - range@neaps)
Speed = 0.8 knots + (1.7 knots – 0.8 knots)X(3.1 m – 2.20 m)/(4.73 m – 2.20 m)
Speed = 0.8 knots + 0.9 knotsX 0.9 m/2.53 m
Speed = 0.8 knots + 0.32 knots = 1.1 knots
USING THE DIAGRAM:
Mark the speed at springs (1.7 knots) on the upper grey horizontal line, (upper red cross). Similarly, mark the speed at neaps (0.8 knots) on the lower horizontal line (lower red cross).
Draw a straight line (non-dashed red line) between these two crosses.
Draw a horizontal line across from the tidal range on June 1st (3.1 m) (horizontal dashed red line). Where this meets the line drawn previously, draw a final line down vertically. This goes to around ‘11’, indicating 1.1 knots.
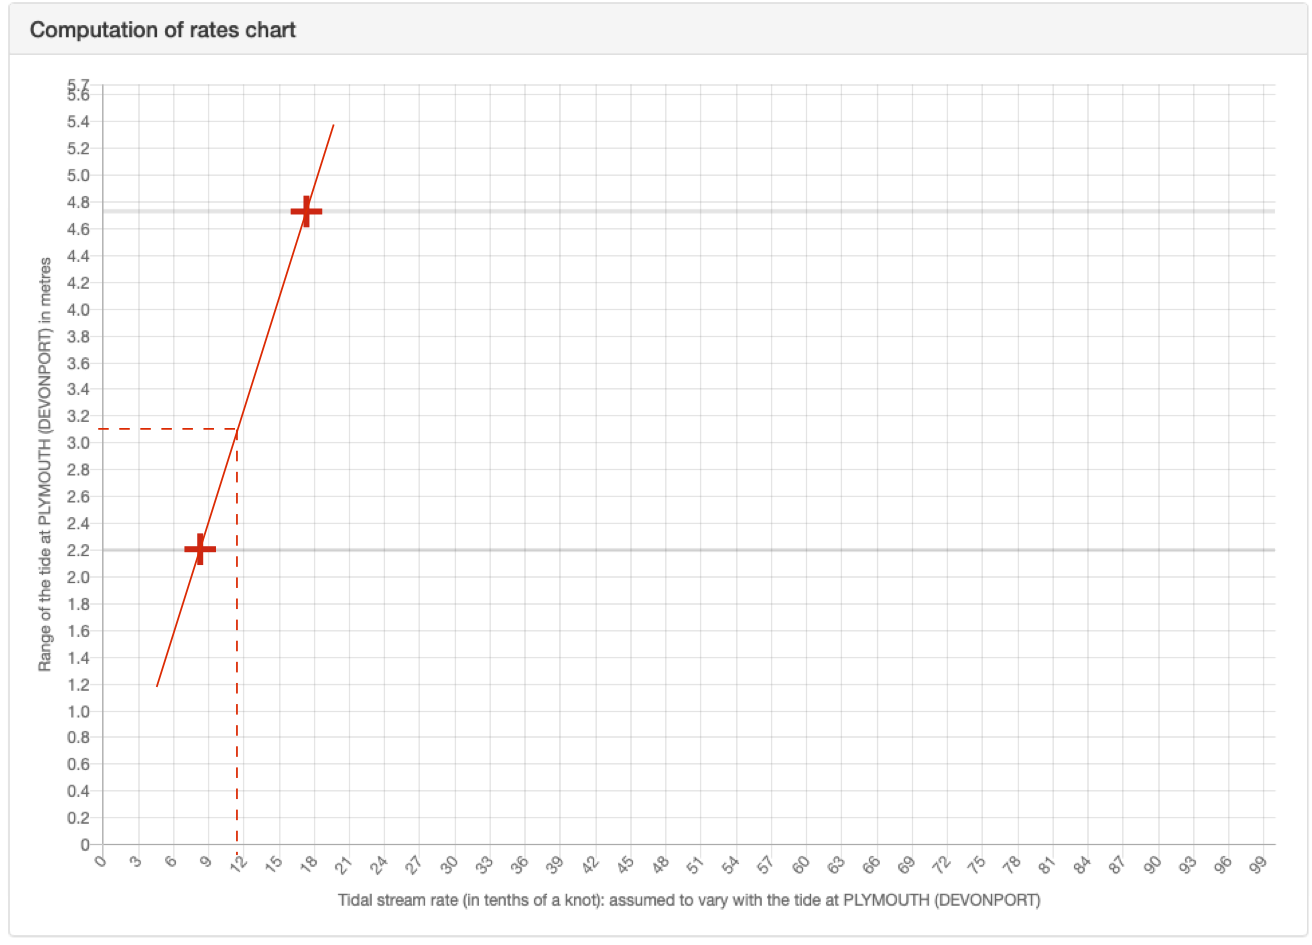
Plot for interpolation of rates marked up
2.4.2 Variation of flow through the tidal cycle*
Pilots will often only give a flow speed at springs, leaving us with the factors method as the only option for estimating flow speed at other tidal ranges. When spring and neap rates are quoted, interpolation can also be used.
Another problem with pilots is that they typically only provide data on when the direction of flow changes (slack water) and what the maximum flow is. We may wish to estimate flow at other times. Two rules of thumb exist to do this – the 50/90 rule and the rule of thirds.
2.4.3 50/90 rule*
The 50/90 rule states that:
- We expect zero flow speed as the tidal stream changes direction (slack water)
- One hour later, the flow attains 50% of maximum speed
- Two hours after slack water, the flow attains 90% maximum speed
- Three hours after slack water, the flow speed is a maximum (100%)
- 90% at 4 hours
- 50% at 5 hours
- Slack water occurs again after 6 hours
It’s fairly obvious that the flow is zero at slack water and maximal 3 hours later. And it’s intuitive that the flow speed decreases in hour 4 and 5 the same way it increased in hours 1 and 2, so the main point to remember is:
50/90 rule: flow attains 50% of max speed after 1 hour, 90% after 2 hours
Let’s look at an example:
Estimate how the tide will vary in Saint Mary’s Sound on 1 June 2020
The pilot tells us:
St Mary’s Sound: The east going stream begins at 5 hours before high water at Plymouth (Devonport). The west going stream begins at 2 hours after high water at Plymouth (Devonport). The flow reaches a speed of 1.7 knots at springs.
Consulting the Plymouth tide table….
First row of tide table for Plymouth
The tide times at Plymouth on June 1st are:
01:53 BST 4.9 m  HW
08:28 BST 1.8 m  LW
14:43 BST 4.9 m  HW
21:02 BST 1.9 m  LW
As we’ve previously calculated: the tidal range is 4.9 m - 1.8 m= 3.1 m, giving a factor of 3.1 m / 4.73 m = 0.65, so maximum flow on June 1st = 0.65 X 1.7 knots = 1.1 knots.
Looking now at the afternoon high water, and recalling the pilot tells us that “The east going stream begins at 5 hours before high water at Plymouth (Devonport). The west going stream begins at 2 hours after high water at Plymouth (Devonport)”:
14:43 BST 4.9 m  HW - 5 hrs = 09:43 : E going stream starts
14:43 BST 4.9 m  HW + 2 hrs = 16:43 : W going stream starts
So, the east going stream will begin at 14:43 -5:00 = 09:43 and run until the west-going stream starts at 14:43 +2:00 = 16:43. We use the 50/90 rule to estimate the flow speeds. Unfortunately, the flow here runs for 7 hours, so we modify the rule slightly with 2 hours of 100% flow rather than one:
| Time | Compared to slack water | 50/90 rule | Flow speed | Direction |
|---|---|---|---|---|
| 09:43 | 0 | 0% | 0 | - |
| 10:43 | +1 | 50% | 0.6 kt | E |
| 11:43 | +2 | 90% | 1.0 kt | E |
| 12:43 | +3 | 100% | 1.1 kt | E |
| 13:43 | +4 | 100% | 1.1 kt | E |
| 14:43 | +5 | 90% | 1.0 kt | E |
| 15:43 | +6 | 50% | 0.6 kt | E |
| 16:43 | 0 | 0% | 0 | - |
2.4.4 Rule of thirds
The rule of thirds is used to estimate average tidal flow speed during each hour. This makes it less useful in estimating flow at a given time, but more helpful if we are trying to estimate average speeds of paddling with tidal assistance (or hindrance). It states that:
- During the first hour after slack water, average flow is 1/3 of maximum
- During the second hour, average flow is 2/3 maximum
- During the third and fourth hours, average flow is equal to the maximum
- During the fifth hour, 2/3 maximum
- During the sixth hour, 1/3 maximum
Again, it’s fairly easy to remember that flow is at a maximum during the third and fourth hours and that the flow speed decreases in hour 5 and 6 the same way it increased in hours 1 and 2, so the main point to remember is:
Rule of thirds: the average flow is 1/3 of max speed in the first hour of the tide, 2/3 in the second hour
You are planning a trip from Bull Point to Lundy Island, a distance of about 17 miles, on May 27th 2025
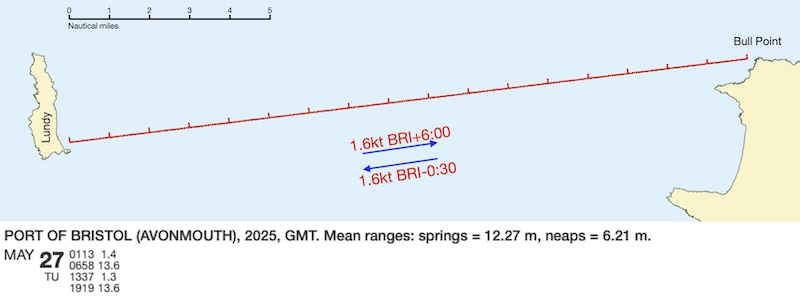
If you depart at the start of the ebb tide, when do you expect to arrive?
On May 27th, high water is 06:58 GMT. For simplicity, we’ll call this 07:00 GMT = 08:00 BST. This is our departure time from Bull Point.
The range is 13.6-1.3 = 12.3 m, which matches the spring range closely, so we will assume that we can use the spring tide flow rate of 1.6 knots directly.
We will assume that our group paddles at 3 knots in still water. So:
During the first hour, the flow is 1.6/3= 0.5 knots, so our total speed is 3+0.5=3.5 knots, and we will cover 3.5 miles by 09:00
During the second hour, the flow is 2X1.6/3=1.1 knots, so our total speed is 3+1.1=4.1 knots and we cover 4.1 miles. We’ve now covered 3.5+4.1 =7.6 miles by 10:00
During the third hour, the flow is 1.6 knots, and our total speed is 4.6 knots, so we’ve covered a total of 12.2 miles by 11:00
During the fourth hour, the flow is 1.1 knots, total speed 4.1 knots, so we cover 16.3 miles by 12:00
During the fifth hour, the flow is 0.5 knots, total speed 3.5 knots, so we would expect to cover the remaining 0.7 miles in 0.2 hours = 12 minutes
So, we expect to arrive around 12:12 at Lundy (this is overly exact - perhaps we should say ‘12:15’). In reality the tidal streams will vary over this distance in ways that we don’t have information on.