4.3 Equivalence tests
As we saw in section 4.2.3, a non-significant null
hypothesis significance test could either mean that the parameter in
question is actually very close to zero; or it could just mean that our sample size was too small. Is the non-significant p-value for
Condition in model m3 strong evidence that mood manipulation has no effect on behavioural inhibition? Or is the study just inconclusive?
Equivalence tests are a complementary type of statistical test that allow you to tackle questions such as these
(Lakens et al., 2018). Instead of asking ‘do the data
suggest that the parameter has a value different from zero?’ they ask do the data suggest that the parameter is equivalent to zero, where the meaning of ‘equivalent’ has been specified. You can perform
equivalence tests on the output of normal R models, using the
contributed package parameters. Before running our equivalence tests
on m3, we will review some of the underlying concepts.
4.3.1 The region of practical equivalence (ROPE)
The first step in performing an equivalence test is to define a region of practical equivalence (ROPE). The ROPE is the region of the parameter space that you take to be as good as zero. To construct your ROPE, first ask yourself, what is the smallest effect size that I would take to be support for my hypothesis? This is known as the smallest effect size of interest or SESOI. You
then define the ROPE as the region between the SESOI in the negative
direction and the SESOI in the positive direction, including zero. To be concrete, let’s say that an SMD of 0.2 is the smallest effect size that we would take as consistent with the hypothesis that mood manipulation has a substantial effect on behavioural inhibition. We thus define our ROPE for Condition in model m3 as the interval {-0.2, 0.2}. If we can confidently estimate the parameter to lie in this interval, then we are confident that the hypothesis is not supported by this dataset.
An equivalence test has three possible outcomes: - The confidence interval for the standardised parameter of interest might be completely within the ROPE. Let’s say you got a standardised parameter estimate of -0.002 with a confidence interval -0.06 to +0.05. In this case, an equivalence test would tell you to accept the hypothesis that your effect is equivalent to zero.
The standardised parameter estimate might be outside the ROPE. For example, you might get a standardised parameter estimate of -0.5. This cannot be equivalent to zero with a ROPE of -0.2 to 0.2. An equivalence test would tell you to reject the hypothesis of equivalence to zero.
The standardised parameter estimate might be within the ROPE, but some of its confidence interval is not. For example, you might get a standardised parameter estimate of -0.1, with a confidence interval from -0.5 to +0.2. This interval includes some effects that are not meaningfully different from zero, and some that are. The equivalence test would tell you that the hypothesis of equivalence to zero is undecided (or inconclusive).
4.3.2 Equivalence tests and null hypothesis significance tests
The surprising thing about equivalence tests is that their results are not just the mirror image of null hypothesis significance tests of the same parameter on the same data. You might think that there would only be two possibilities: the NHST is significant and the hypothesis of equivalence to zero is rejected; or the NHST is not significant and the hypothesis of equivalence to zero is accepted. In fact, when you do both kinds of tests on the same data, there are five possible outcomes!
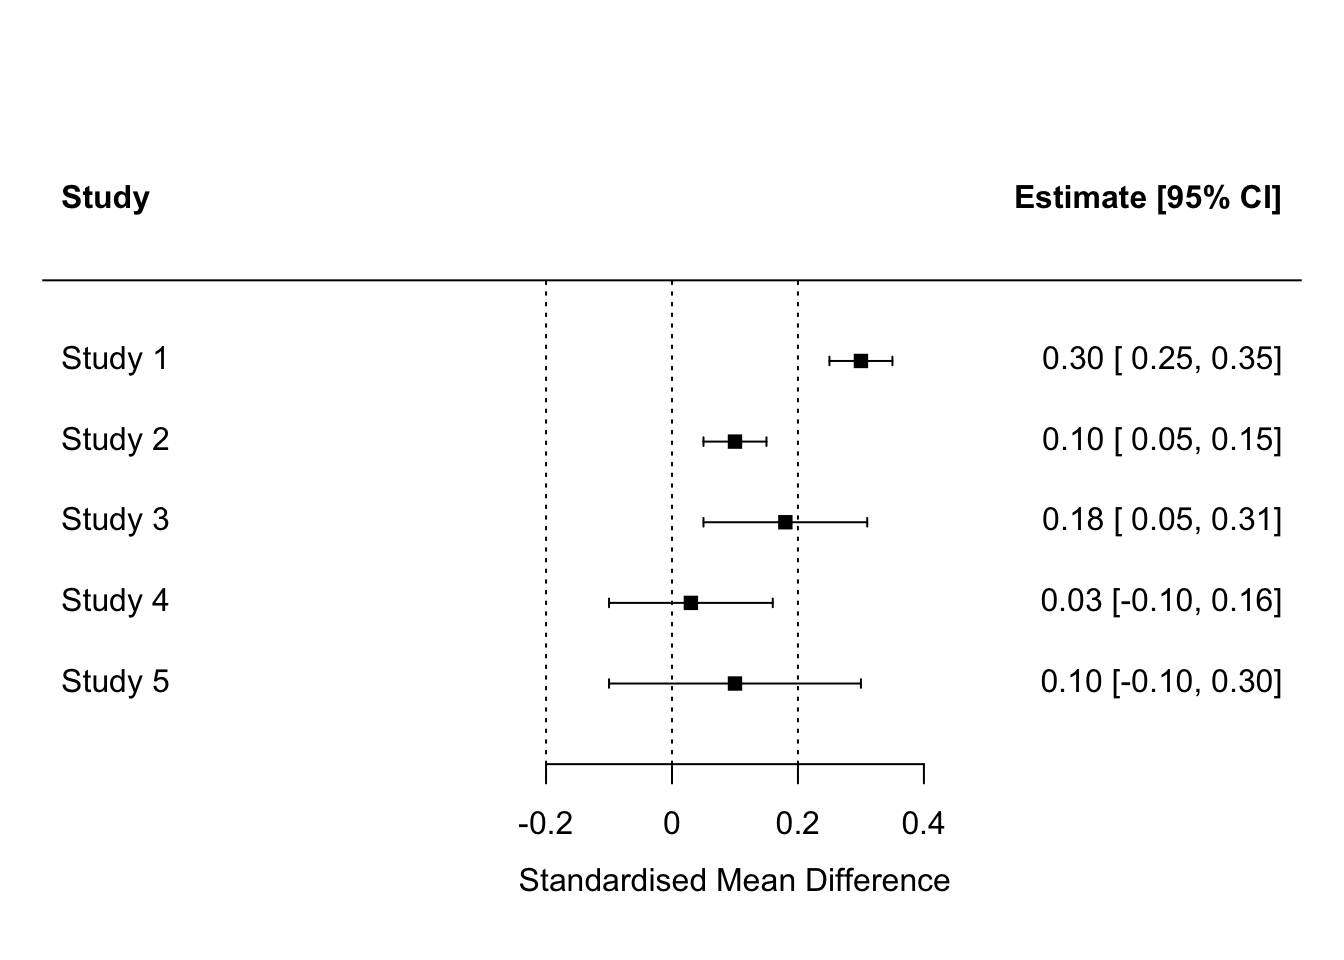
The possible results of the NHST are {significant, not significant}, and the possible results of the equivalence tests are that equivalence is {accepted, rejected, undecided}. Five of the six possible combinations of results can occur. These five scenarios are illustrated on the plot below. This kind of plot is called a coefficient plot or forest plot. Each square represents a standardised parameter estimate, positioned along the horizontal axis by its value. The whiskers show the 95% confidence interval. Assume we have defined the ROPE as the interval \((-0.2, 0.2)\) in terms of SMD.
Here:
In study 1 we have an effect which is significant by null hypothesis significance test (zero is not in the confidence interval), and the hypothesis of equivalence to zero is rejected (all of the confidence interval is outside the ROPE). Colloquially, the study showed that there is an effect and that it is big enough to matter.
In study 2, we have an effect which is significant by null hypothesis significance test, but the effect is so small that the entire confidence interval is within the ROPE, so the hypothesis of equivalence to zero is accepted. The effect is significantly different from zero, but equivalent to zero according to the ROPE criteria given. Colloquially, the study showed that there is an effect, but also showed that it is too small to matter.
In study 3, we have an effect which is significant by null hypothesis significance test, but the equivalence test is undecided, because some of the confidence interval of the parameter is inside the ROPE, and some of it is outside. Colloquially, the study showed that there is an effect but did not provide enough evidence to know whether the effect is big enough to matter.
In study 4, we have an effect which is not significant by null hypothesis significance test, and the hypothesis of equivalence to zero is accepted. Colloquially, the study showed that there is no effect here big enough to matter.
In study 5, we have an effect which is not significant by null hypothesis significance test, and the hypothesis of equivalence to zero is undecided because some of the confidence interval is outside the ROPE. Colloquially, the study did not establish that there is an effect, nor whether or not any effect is big enough to matter.
I hope that your studies give you results like study 1 or study 4. At least they are clear-cut! Often though, they will not, and you will find yourself in one of the more inconclusive scenarios. Results like study 3 or study 5 could indicate that your sample size was too small to clearly answer your question.
4.3.3 How to do equivalence tests
The contributed package parameters contains a function called equivalence_test() and it takes a model object as its argument. An important point, though: prior to using the
equivalence_test() function, you want to scale as well as centre all
the continuous variables in the model, including the outcome variable.
This is to make sure that all the coefficients come out on the
standardised scale, not the scale of raw milliseconds. Let’s define that model, making use of the function scale():
Now let’s call equivalence_test() on model m3b, specifying the ROPE
as the interval {-0.2, 0.2}.
 What do we have? For
 Deprivation_Score, Age and GRT, we reject
equivalence. We are in scenario 1: there are associations and they are
big enough to matter. For Condition, the critical IV, the result is
‘Undecided’. The experiment was underpowered to provide a confident
answer to whether there is any meaningful effect of mood manipulation on SSRT, or not.
You will see that the equivalence_test() output
provides a p-value. This is not the usual p-value of the null hypothesis significance test on the same model. Rather, it is \(p_{equivalence}\). A small \(p_{equivalence}\) (< 0.05) means that you can accept the hypothesis of equivalence. We don’t have any small values of \(p_{equivalence}\) here! Note by the way that equivalence tests using equivalence_test() are based on the 90% confidence interval for the parameter estimate, whereas you will see 95% confidence intervals for parameter estimates more commonly reported.
The results of the equivalence test depend strongly on the ROPE you choose. If you choose a very wide ROPE, you are effectively saying ‘an effect would have to be really big before I counted it as meaningful’. With a wide ROPE, more equivalence tests will tend to become significant and more hypotheses of equivalence to zero are accepted. Try:
 Now all of the equivalence tests are significant other than the one for
 Age (and that one is not far off).
4.3.4 When should you report equivalence tests?
Equivalence testing entered psychology and behavioural science as an addendum to null hypothesis significance testing to report in cases where that result was not significant. It was thought of adding extra information to allow the reader to differentiate whether the results provided strong evidence for no meaningful effect, or were just inconclusive as to whether there was an effect or not. Thus, one scenario where you may well want to report equivalence tests is where you have important hypothesis tests whose results are non-significant.
In fact, however, you don’t need to restrict equivalence tests to just this scenario. You can use them more generally to ask: do I have a meaningful effect here, as opposed to just one that is different from zero by an arbitrarily small amount? Equivalence tests, along with focus on effect size more generally, draw attention to practical and theoretical significance, not just narrow statistical significance. There is therefore a case for using equivalence tests very widely in studies where hypotheses are tested. If you are presenting null hypothesis significance tests, consider adding equivalence tests as complements, regardless of the outcome.
Equivalence tests can also be used as statistical justifications for treating data sets as comparable. For example, you might want to show that the people in your patient group and the people in your healthy volunteer group were equivalent in terms of age, income, or BMI. The equivalence tests here are used to provide evidence that the groups are not too different on dimensions other than the disease you are studying. Or, equivalence tests could be used to justify pooling two different data sets and doing an analysis of them combined. If the two data sets are equivalent on key variables (to within a reasonable ROPE), it is justifiable to treat them as representing the same underlying population.